Here’s a detailed technical analysis of **Reliance Industries Ltd (RELIANCE)** based on the images you provided:
---
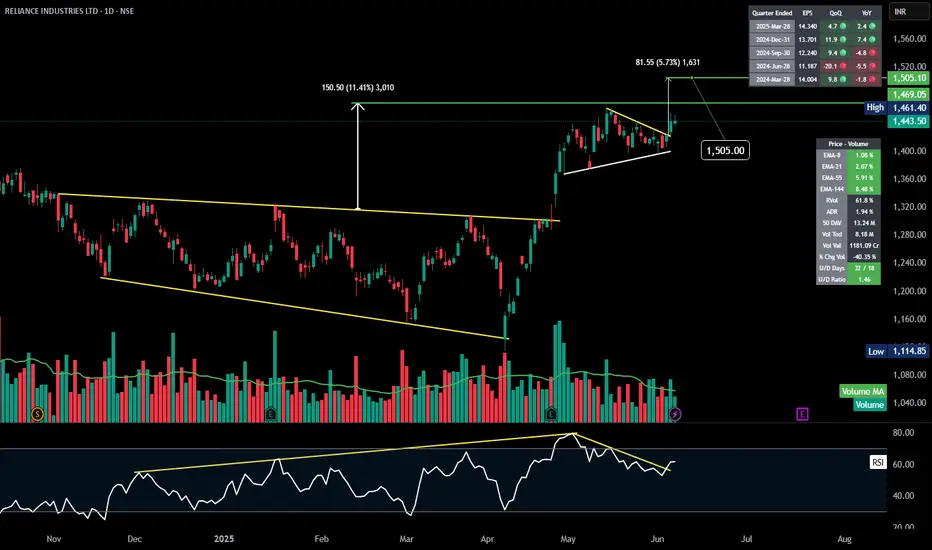
### 📊 **1️⃣ Pattern Overview:**
* **Falling Wedge Pattern:**
* A large falling wedge spanning several months from 2024 to early 2025, clearly visible in the first set of images.
* The stock broke out of the wedge in April-May 2025, leading to a significant up-move.
* **Continuation Triangle Pattern:**
* Post breakout, the stock formed a symmetrical triangle (or continuation pennant) in late May to early June 2025.
* The stock has just broken out of this consolidation, suggesting a continuation of the uptrend.
---
### 📈 **2️⃣ Key Levels:**
* **Breakout Levels:**
* Falling Wedge breakout: Around **1,300**
* Continuation Triangle breakout: Around **1,443.50 - 1,461.40**
* **Current Price:** **1,443.50**
* **Measured Move Targets:**
* Wedge depth measured move: \~**150.50 points** (11.41%)
* Continuation triangle target: \~**81.55 points** (5.73%)
* **Price Targets:** **1,505.00** and possibly **1,531 - 1,540** based on the continuation move.
---
### 💡 **3️⃣ Indicators & Confirmation:**
* **Volume:**
* Noticeable volume spikes during breakouts, confirming strong buying interest.
* Post-breakout consolidation volumes have been healthy (lower, indicating accumulation).
* **RSI:**
* Divergence in RSI before the wedge breakout (lower lows in price, but not in RSI – bullish divergence).
* Currently, RSI is bouncing back from around 60, supporting continued bullish momentum.
* **EMA Analysis:**
* EMA-8, EMA-21, EMA-55, EMA-144 all sloping up, indicating strong trend alignment.
* EMA-8 and EMA-21 holding as dynamic support, especially on the 1,443 breakout.
---
### ⚙️ **4️⃣ Key Support and Resistance:**
* **Supports:**
* 1,443-1,461 zone: Breakout levels and EMA cluster support.
* 1,300 zone: Former wedge breakout level and major pivot support.
* **Immediate Resistance:**
* 1,505.00 (immediate price target)
* Followed by 1,531-1,540 zone.
---
### 🚦 **5️⃣ Risk Management / Trade Strategy:**
* **Stops:**
* Conservative stop-loss: Below 1,443 (immediate breakout zone).
* Wider stop-loss: Below 1,400 (where EMA-21 is likely to support).
* **Entry:**
* Re-entry on pullbacks to breakout levels (1,443-1,461) with tight risk control.
* **Upside Potential:**
* Short-term: 1,505
* Medium-term: 1,540 zone
---
### 🔍 **Summary:**
✅ **Bullish Wedge breakout** has been confirmed and has driven the stock significantly higher.
✅ **Continuation triangle breakout** at 1,443-1,461 zone suggests further upside to 1,505 and 1,540.
✅ RSI, volume, and EMAs align with a continued bullish bias.
---
💬 **Would you like me to draft a YouTube video script, a trading plan document, or a social media post for this analysis? Let me know! 🚀**
---
### 📊 **1️⃣ Pattern Overview:**
* **Falling Wedge Pattern:**
* A large falling wedge spanning several months from 2024 to early 2025, clearly visible in the first set of images.
* The stock broke out of the wedge in April-May 2025, leading to a significant up-move.
* **Continuation Triangle Pattern:**
* Post breakout, the stock formed a symmetrical triangle (or continuation pennant) in late May to early June 2025.
* The stock has just broken out of this consolidation, suggesting a continuation of the uptrend.
---
### 📈 **2️⃣ Key Levels:**
* **Breakout Levels:**
* Falling Wedge breakout: Around **1,300**
* Continuation Triangle breakout: Around **1,443.50 - 1,461.40**
* **Current Price:** **1,443.50**
* **Measured Move Targets:**
* Wedge depth measured move: \~**150.50 points** (11.41%)
* Continuation triangle target: \~**81.55 points** (5.73%)
* **Price Targets:** **1,505.00** and possibly **1,531 - 1,540** based on the continuation move.
---
### 💡 **3️⃣ Indicators & Confirmation:**
* **Volume:**
* Noticeable volume spikes during breakouts, confirming strong buying interest.
* Post-breakout consolidation volumes have been healthy (lower, indicating accumulation).
* **RSI:**
* Divergence in RSI before the wedge breakout (lower lows in price, but not in RSI – bullish divergence).
* Currently, RSI is bouncing back from around 60, supporting continued bullish momentum.
* **EMA Analysis:**
* EMA-8, EMA-21, EMA-55, EMA-144 all sloping up, indicating strong trend alignment.
* EMA-8 and EMA-21 holding as dynamic support, especially on the 1,443 breakout.
---
### ⚙️ **4️⃣ Key Support and Resistance:**
* **Supports:**
* 1,443-1,461 zone: Breakout levels and EMA cluster support.
* 1,300 zone: Former wedge breakout level and major pivot support.
* **Immediate Resistance:**
* 1,505.00 (immediate price target)
* Followed by 1,531-1,540 zone.
---
### 🚦 **5️⃣ Risk Management / Trade Strategy:**
* **Stops:**
* Conservative stop-loss: Below 1,443 (immediate breakout zone).
* Wider stop-loss: Below 1,400 (where EMA-21 is likely to support).
* **Entry:**
* Re-entry on pullbacks to breakout levels (1,443-1,461) with tight risk control.
* **Upside Potential:**
* Short-term: 1,505
* Medium-term: 1,540 zone
---
### 🔍 **Summary:**
✅ **Bullish Wedge breakout** has been confirmed and has driven the stock significantly higher.
✅ **Continuation triangle breakout** at 1,443-1,461 zone suggests further upside to 1,505 and 1,540.
✅ RSI, volume, and EMAs align with a continued bullish bias.
---
💬 **Would you like me to draft a YouTube video script, a trading plan document, or a social media post for this analysis? Let me know! 🚀**
Penafian
Maklumat dan penerbitan adalah tidak bertujuan, dan tidak membentuk, nasihat atau cadangan kewangan, pelaburan, dagangan atau jenis lain yang diberikan atau disahkan oleh TradingView. Baca lebih dalam Terma Penggunaan.
Penafian
Maklumat dan penerbitan adalah tidak bertujuan, dan tidak membentuk, nasihat atau cadangan kewangan, pelaburan, dagangan atau jenis lain yang diberikan atau disahkan oleh TradingView. Baca lebih dalam Terma Penggunaan.