Price Movement (1H Candles)
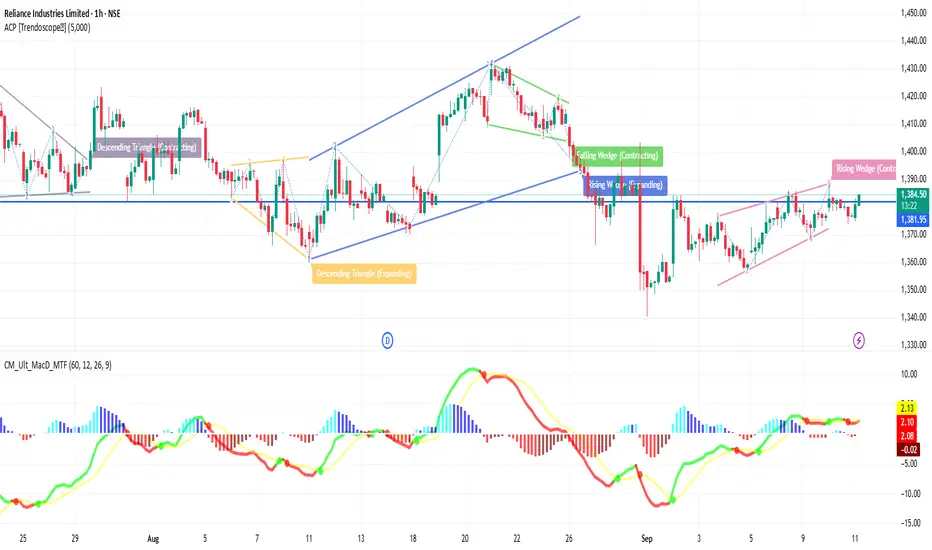
Reliance is trading around ₹1,381 – ₹1,383.
On the 1-hour chart, candles are showing sideways consolidation between ₹1,375 (support) and ₹1,385 (resistance).
This tells us that buyers and sellers are in balance, waiting for a breakout.
2️⃣ Support & Resistance Zones
Immediate Support: ~₹1,375 → If this breaks, price may slip toward ₹1,360.
Stronger Support: ~₹1,345 – ₹1,340 → A key zone where buyers may return strongly.
Immediate Resistance: ~₹1,385 → A breakout above can open the way to ₹1,395 – ₹1,400.
Major Resistance: ~₹1,415 – ₹1,420 → If crossed, trend becomes strongly bullish.
3️⃣ Indicators (1H View)
20 EMA: Very close to current price, showing consolidation.
50 EMA: Just below current levels, acting as dynamic support.
200 EMA: Much lower, confirming long-term uptrend is intact.
RSI: Neutral (around 50) → market is not overbought, not oversold.
MACD: Flat → no clear momentum yet, waiting for direction.
4️⃣ Trend Explanation
Right now, the 1-hour trend is neutral to mildly bullish.
If Reliance holds above ₹1,375 – ₹1,360, bulls remain in control.
A move above ₹1,385 with volume can trigger a rally toward ₹1,400+.
But if Reliance breaks below ₹1,360, weakness may appear, and the next fall could be toward ₹1,340.
5️⃣ Conclusion (1H Time Frame)
Sideways Phase: Reliance is consolidating in a narrow band.
Bullish Signal: Above ₹1,385 with good buying volume.
Bearish Signal: Below ₹1,375, deeper support around ₹1,360.
Traders should wait for a breakout or breakdown before taking big positions.
Penerbitan berkaitan
Penafian
Maklumat dan penerbitan adalah tidak bertujuan, dan tidak membentuk, nasihat atau cadangan kewangan, pelaburan, dagangan atau jenis lain yang diberikan atau disahkan oleh TradingView. Baca lebih dalam Terma Penggunaan.
Penerbitan berkaitan
Penafian
Maklumat dan penerbitan adalah tidak bertujuan, dan tidak membentuk, nasihat atau cadangan kewangan, pelaburan, dagangan atau jenis lain yang diberikan atau disahkan oleh TradingView. Baca lebih dalam Terma Penggunaan.