Seizing the $REQ Turnaround: A Detailed 4-Hour Chart Breakdown
Seizing the $REQ Turnaround: A Detailed 4-Hour Chart Breakdown
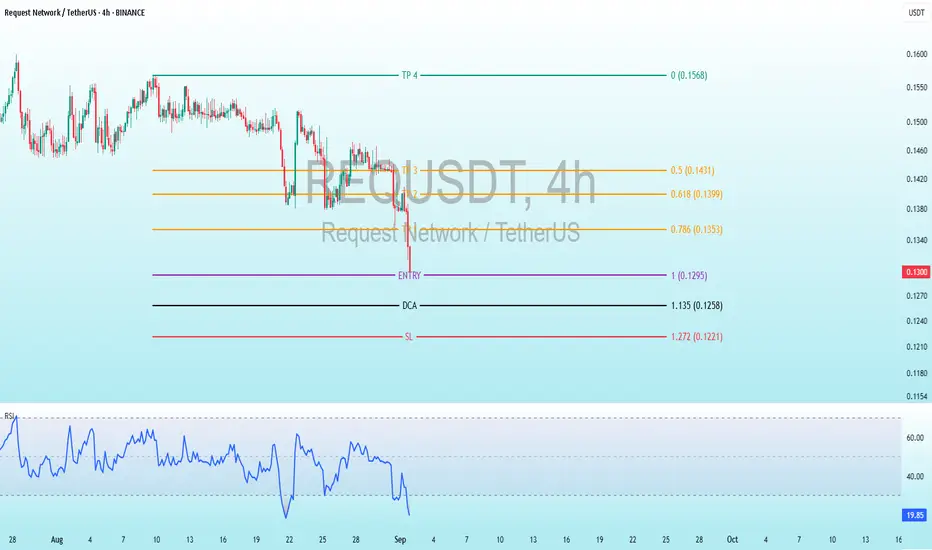
Price Action Description
Historical Trend: The price started around 0.18-0.20 USDT in late August, with a gradual decline punctuated by choppy movements. A sharp drop occurred in early September, pushing it toward 0.12-0.13 USDT, followed by a brief recovery attempt.
Recent Movement: A significant red candlestick around September 1 marks a drop from approximately 0.15-0.16 USDT to 0.1297 USDT (current price), suggesting a strong selling pressure or market event. The price has stabilized near this level, with smaller candles indicating potential consolidation.
Current Price: Approximately 0.1297 USDT, down about 20-30% from late August highs, hinting at possible oversold conditions.
Volatility: Moderate to high, as seen in the long wicks and large candle bodies, especially during the recent drop, though volume data is not visible.
Key Technical Levels
Entry: Set at 0.1295 USDT, the suggested point to enter a long position, very close to the current price of 0.1297 USDT, indicating an immediate buy opportunity with minimal pullback expected.
TP (Take Profit): Targets are 0.1786 USDT for the first profit take, followed by 0.1618 USDT, 0.1431 USDT, and the highest goal at 0.1568 USDT, providing a range of exit points for potential gains.
DCA: Positioned at 0.1350 USDT, a level to add to the trade if the price dips slightly, helping to average down the entry cost.
SL (Stop Loss): Placed at 0.1272 USDT, the cutoff to exit the trade if the price falls, limiting losses and protecting the position.
Fibonacci Context: These levels likely stem from a Fibonacci retracement or extension tool applied to the recent drop from 0.18 USDT to 0.1297 USDT, suggesting a potential reversal zone for a long setup.
Risk-Reward: Risk from 0.1295 to 0.1272 is 0.0023 USDT, with rewards to 0.1431 (0.0136, RR 5.9:1) and up to 0.1786 (0.0491, RR ~21.3:1), indicating an exceptionally favorable setup if the bounce materializes.
Indicators Analysis
RSI (Relative Strength Index): Current value is 19.52, below 30, signaling oversold conditions and a potential rebound. The line has trended downward sharply with the recent drop, showing momentum weakening, but no clear bullish divergence yet. The RSI scale (0-100) marks overbought above 70, not relevant here.
Potential Trading Implications and Risks
Bullish Case: The setup suggests a bottom-fishing opportunity post-drop, supported by oversold RSI. A rebound to take-profit levels is plausible if the broader crypto market stabilizes (e.g., Bitcoin trends) or if positive news emerges for Request Network (e.g., adoption updates).
Bearish Case: The recent sharp decline and lack of immediate recovery indicate ongoing selling pressure. Breaking below 0.1272 (SL) could lead to further declines toward 0.12 USDT or lower.
Market Context: As of 11:11 PM CEST on September 1, 2025, check for recent developments—e.g., network upgrades, partnerships, or macro factors like interest rate shifts affecting altcoins.
Risks: Moderate altcoin volatility, lack of volume data (limiting liquidity insight), and subjective Fib levels. Use risk management (e.g., 1-2% account risk).
Suggestions: Confirm with bullish patterns (e.g., hammer) at 0.1295 or RSI crossing above 30.
Dagangan ditutup: hentian tercapai
✅MY Free Signals Telegram
t.me/AltcoinPiooners
✅Personal Telegram (Premium)
t.me/Altcoin_Piooners
✅YouTube
youtube.com/@AltcoinPiooners
t.me/AltcoinPiooners
✅Personal Telegram (Premium)
t.me/Altcoin_Piooners
✅YouTube
youtube.com/@AltcoinPiooners
Penafian
Maklumat dan penerbitan adalah tidak dimaksudkan untuk menjadi, dan tidak membentuk, nasihat untuk kewangan, pelaburan, perdagangan dan jenis-jenis lain atau cadangan yang dibekalkan atau disahkan oleh TradingView. Baca dengan lebih lanjut di Terma Penggunaan.