📊 Riot Platforms (RIOT) – Technical Analysis
1. Current Price Action
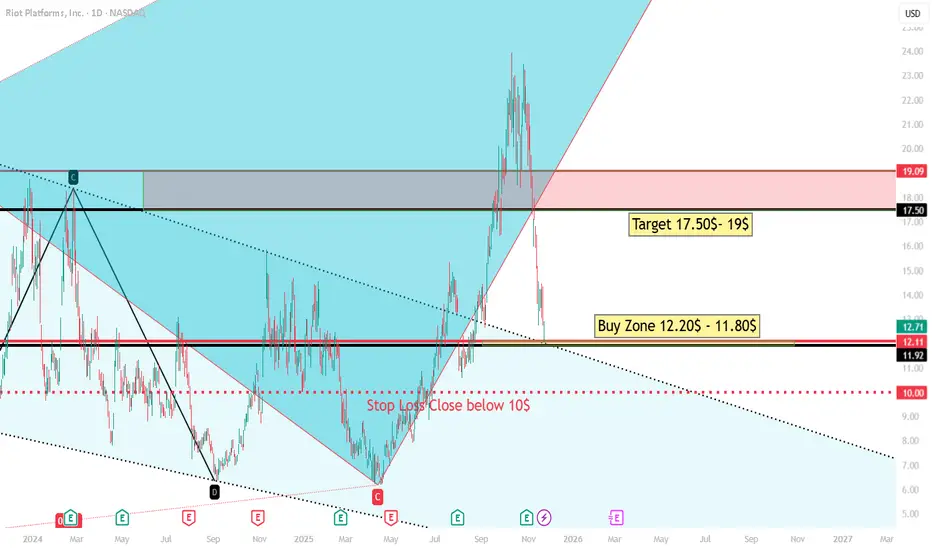
The stock is trading around $12.7, showing a sharp pullback after a strong rally. The recent decline brought price back into a previously established demand/support region.
2. Key Levels
🔵 Buy Zone: $12.20 – $11.80
This zone is clearly marked on your chart and aligns with:
A previous support–resistance flip
The lower boundary of the recent breakout area
A potential Fibonacci retracement region (based on the structure)
Price is currently sitting just above this area, meaning the stock is approaching an attractive risk-to-reward entry level.
🔴 Stop Loss: Close Below $10
The $10 level is critical because:
It’s a major psychological support
It aligns with the bottom of a broader descending trendline zone
A close below it would break the bullish structure and invalidate the long setup
This makes it a logical and conservative stop-loss placement.
3. Target Zones
🎯 Target 1: $17.50
This level corresponds to:
The previous consolidation / supply zone
A Fibonacci extension / measured move region
A strong horizontal resistance visible on the chart
🎯 Target 2: $19.00
This is the upper boundary of the supply zone and a likely strong resistance point if momentum continues.
These targets provide a 3:1 to 4:1 risk-to-reward ratio, making the trade setup attractive if the buy zone holds.
4. Trend Structure
Your chart highlights:
A completed harmonic/gartley-like formation (C-D leg)
A breakout from a long-term descending trendline
A bullish channel formation after the breakout
The current pullback appears to be a healthy retest of:
The breakout zone
Major support
Demand region
If price stabilizes around $12.20–$11.80, the uptrend may resume.
5. Volume & Momentum
Although not explicitly shown in the screenshot, the price behavior indicates:
A sharp decline but without major capitulation volume
A possible formation of a higher low (if Buy Zone holds)
This suggests sellers may be losing strength as price approaches support.
📈 Summary – Professional Outlook
Bias: Bullish as long as price stays above $10
Entry Area: $12.20 – $11.80 (high-probability demand zone)
Targets:
First: $17.50
Second: $19.00
Stop Loss: Close below $10
Setup Type: Pullback to support / trend continuation
1. Current Price Action
The stock is trading around $12.7, showing a sharp pullback after a strong rally. The recent decline brought price back into a previously established demand/support region.
2. Key Levels
🔵 Buy Zone: $12.20 – $11.80
This zone is clearly marked on your chart and aligns with:
A previous support–resistance flip
The lower boundary of the recent breakout area
A potential Fibonacci retracement region (based on the structure)
Price is currently sitting just above this area, meaning the stock is approaching an attractive risk-to-reward entry level.
🔴 Stop Loss: Close Below $10
The $10 level is critical because:
It’s a major psychological support
It aligns with the bottom of a broader descending trendline zone
A close below it would break the bullish structure and invalidate the long setup
This makes it a logical and conservative stop-loss placement.
3. Target Zones
🎯 Target 1: $17.50
This level corresponds to:
The previous consolidation / supply zone
A Fibonacci extension / measured move region
A strong horizontal resistance visible on the chart
🎯 Target 2: $19.00
This is the upper boundary of the supply zone and a likely strong resistance point if momentum continues.
These targets provide a 3:1 to 4:1 risk-to-reward ratio, making the trade setup attractive if the buy zone holds.
4. Trend Structure
Your chart highlights:
A completed harmonic/gartley-like formation (C-D leg)
A breakout from a long-term descending trendline
A bullish channel formation after the breakout
The current pullback appears to be a healthy retest of:
The breakout zone
Major support
Demand region
If price stabilizes around $12.20–$11.80, the uptrend may resume.
5. Volume & Momentum
Although not explicitly shown in the screenshot, the price behavior indicates:
A sharp decline but without major capitulation volume
A possible formation of a higher low (if Buy Zone holds)
This suggests sellers may be losing strength as price approaches support.
📈 Summary – Professional Outlook
Bias: Bullish as long as price stays above $10
Entry Area: $12.20 – $11.80 (high-probability demand zone)
Targets:
First: $17.50
Second: $19.00
Stop Loss: Close below $10
Setup Type: Pullback to support / trend continuation
Penafian
Maklumat dan penerbitan adalah tidak bertujuan, dan tidak membentuk, nasihat atau cadangan kewangan, pelaburan, dagangan atau jenis lain yang diberikan atau disahkan oleh TradingView. Baca lebih dalam Terma Penggunaan.
Penafian
Maklumat dan penerbitan adalah tidak bertujuan, dan tidak membentuk, nasihat atau cadangan kewangan, pelaburan, dagangan atau jenis lain yang diberikan atau disahkan oleh TradingView. Baca lebih dalam Terma Penggunaan.