Wave Structure Summary:
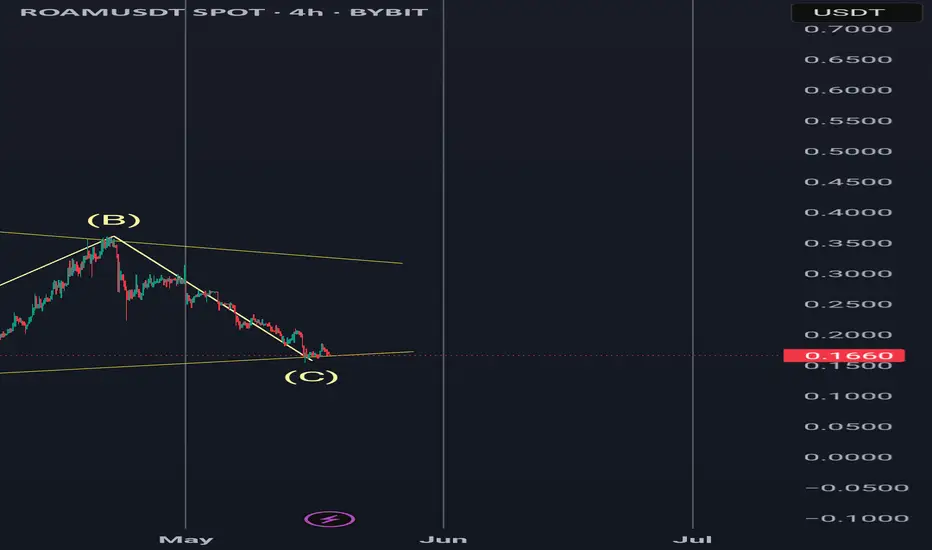
The chart shows a clear A-B-C corrective structure within a descending channel.
Wave A: Strong initial drop.
Wave B: Sharp corrective rally to the top of the channel.
Wave C: Currently in a 5-wave impulsive decline, potentially nearing completion at the lower boundary (~0.17 USDT).
The structure may also be interpreted as a W-X-Y complex correction under NeoWave principles.
Trading Scenarios:
Scenario 1 – Bullish Reversal (Wave C Complete):
Entry: 0.165 – 0.175 (after bullish candle confirmation).
Stop-Loss: Below 0.155.
Targets:
TP1: 0.22
TP2: 0.28
TP3: 0.35+ (if breakout confirms).
Scenario 2 – Bearish Continuation (Wave C Extends):
Entry: On 4H close below 0.155.
Stop-Loss: Above 0.17.
Targets:
TP1: 0.13
TP2: 0.10
Penafian
Maklumat dan penerbitan adalah tidak dimaksudkan untuk menjadi, dan tidak membentuk, nasihat untuk kewangan, pelaburan, perdagangan dan jenis-jenis lain atau cadangan yang dibekalkan atau disahkan oleh TradingView. Baca dengan lebih lanjut di Terma Penggunaan.
Penafian
Maklumat dan penerbitan adalah tidak dimaksudkan untuk menjadi, dan tidak membentuk, nasihat untuk kewangan, pelaburan, perdagangan dan jenis-jenis lain atau cadangan yang dibekalkan atau disahkan oleh TradingView. Baca dengan lebih lanjut di Terma Penggunaan.