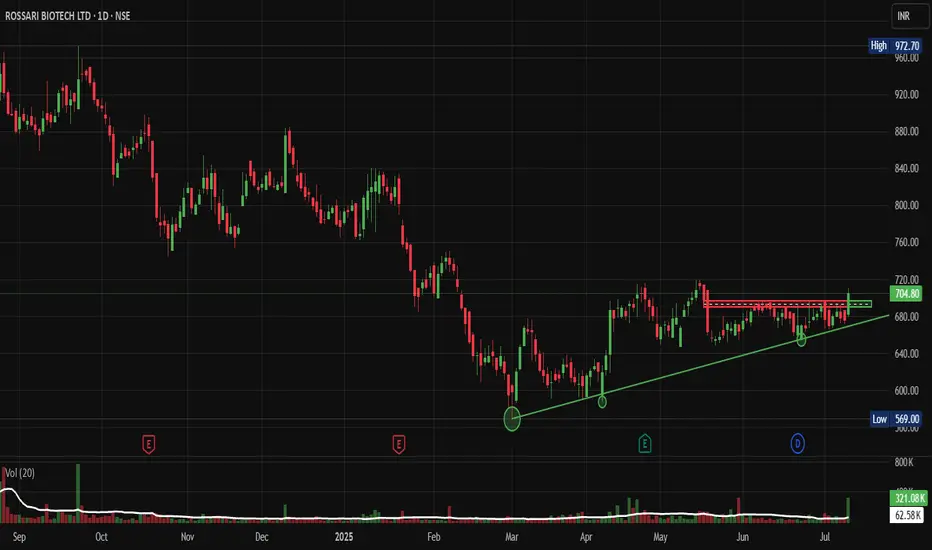
Rossari: Ready to Break Out from Multi-Month Consolidation

Price Action:
- Stock has been in a prolonged consolidation phase since March 2025, after a significant decline from highs near 970 levels
- Current price action shows the formation of a symmetrical triangle pattern with converging trend lines
- Recent price movement indicates a potential breakout attempt with increased volume participation
- The stock has found strong support around 580-600 levels and resistance near the 720-740 zone
Volume Spread Analysis:
Volume Characteristics:
- Volume has been declining during the consolidation phase, which is typical for triangle patterns
- Recent sessions show increasing volume participation, suggesting institutional interest
- Volume spike during recent upward movement indicates genuine buying interest
- Average volume appears to be around 300-400K shares, with recent pickup to 620K+
Volume Confirmation Signals:
- Higher volume on up days compared to down days in recent sessions
- Volume expansion during the recent breakout attempt
- Accumulation pattern visible in volume profile during base formation
Base Formation:
- Primary base formation: Large consolidation base formed between 580-740 levels over 7+ months
- Base characteristics: Symmetrical triangle with higher lows
- Base depth: Approximately 27% from resistance to support levels
- Time duration: An Extended 7-month base suggests a strong accumulation phase
Key Support and Resistance Levels:
- Immediate Support: 680-690 (recent swing low)
- Major Support: 580-600 (tested multiple times, strong buying interest)
- Immediate Resistance: 720-740 (upper trend line of triangle)
- Major Resistance: 800-820 (previous significant resistance zone)
- Ultimate Resistance: 900-920 (prior consolidation area)
Technical Patterns:
- Primary Pattern: Symmetrical Triangle
- Secondary Pattern: Potential Cup and Handle formation within the larger triangle
- Volume Pattern: Decreasing volume during consolidation with recent pickup suggesting breakout preparation
- Price compression: Narrowing price range indicates imminent directional move
Trade Setup:
Entry Strategy:
- Primary Entry: On breakout above 720-725 with volume confirmation
- Secondary Entry: On pullback to 700-705 levels after successful breakout
- Aggressive Entry: Current levels around 704-706 for risk-tolerant traders
Exit Levels:
- Target 1: 760-770 (measured move from triangle base)
- Target 2: 800-820 (previous resistance zone)
- Target 3: 860-880 (extended target based on base depth)
- Ultimate Target: 920-950 (full triangle breakout target)
Stop-Loss Strategy:
- Conservative Stop-Loss: Below 680 (recent swing low)
- Aggressive Stop-Loss: Below 695 (intraday support)
- Trailing Stop: Move to breakeven once Target 1 is achieved
Position Sizing:
- Risk per trade: Maximum 2% of portfolio
- Position size calculation: Based on stop-loss distance from entry
- For entry at 705 with stop at 680: Risk of 25 points allows for appropriate position sizing
- Recommended allocation: 3-5% of portfolio for medium-term holding
Risk Management:
- Maximum drawdown tolerance: 3-4% from entry point
- Partial profit booking at each target level (25% at each target)
- Trailing stop-loss implementation after achieving Target 1
- Time-based exit if no progress within 3-4 weeks
Sectoral and Fundamental Backdrop:
Sector Overview:
- The speciality chemicals sector is showing resilience in the current market conditions
- Increasing demand for sustainable and eco-friendly chemical solutions
- The government push for domestic manufacturing under PLI schemes
- Growing export opportunities in the speciality chemicals space
Company Fundamentals:
- Business Profile: Speciality chemicals manufacturer focusing on home, personal care, and fabric care segments
- Revenue Growth: Consistent growth trajectory in recent quarters
- Market Position: Strong presence in domestic market with expanding export footprint
- Product Portfolio: Diversified range of speciality chemicals and ingredients
Industry Tailwinds:
- Increasing consumer spending on personal care products
- Growing demand for sustainable and biodegradable chemical products
- Import substitution opportunities in speciality chemicals
- Rising per capita income is driving demand for quality personal care products
Fundamental Catalysts:
- New product launches and capacity expansions
- Strategic partnerships and collaborations
- Improving operational efficiency and margin expansion
- Strong balance sheet supporting growth investments
Risk Factors:
Technical Risks:
- Failure to sustain above 720 levels could lead to further consolidation
- Breakdown below 680 could trigger deeper correction to 600-620 levels
- Low liquidity may result in higher volatility during a breakout
Fundamental Risks:
- Raw material price inflation is impacting margins
- Competitive pressure from larger players
- Regulatory changes affecting product approvals
- Currency fluctuation impact on export revenues
My Take:
Keep in the Watchlist.
NO RECO. For Buy/Sell.
📌Thank you for exploring my idea! I hope you found it valuable.
🙏FOLLOW for more
👍BOOST if you found it useful.
✍️COMMENT below with your views.
Meanwhile, check out my other stock ideas on the right side until this trade is activated. I would love your feedback.
Disclaimer: "I am not a SEBI REGISTERED RESEARCH ANALYST AND INVESTMENT ADVISER."
This analysis is intended solely for informational and educational purposes and should not be interpreted as financial advice. It is advisable to consult a qualified financial advisor or conduct thorough research before making investment decisions.
Dagangan aktif
Target 1: 760-770 (measured move from triangle base) Done in intraday Swing todayPenerbitan berkaitan
Penafian
Maklumat dan penerbitan adalah tidak bertujuan, dan tidak membentuk, nasihat atau cadangan kewangan, pelaburan, dagangan atau jenis lain yang diberikan atau disahkan oleh TradingView. Baca lebih dalam Terma Penggunaan.
Penerbitan berkaitan
Penafian
Maklumat dan penerbitan adalah tidak bertujuan, dan tidak membentuk, nasihat atau cadangan kewangan, pelaburan, dagangan atau jenis lain yang diberikan atau disahkan oleh TradingView. Baca lebih dalam Terma Penggunaan.