RattanIndia Power, a penny stock, has been making the rounds lately with a sharp rally from ₹8.51 to ₹16.24. The buzz is strong, and retail interest is rising—but even with penny stocks, it’s worth taking a proper technical look before jumping in.
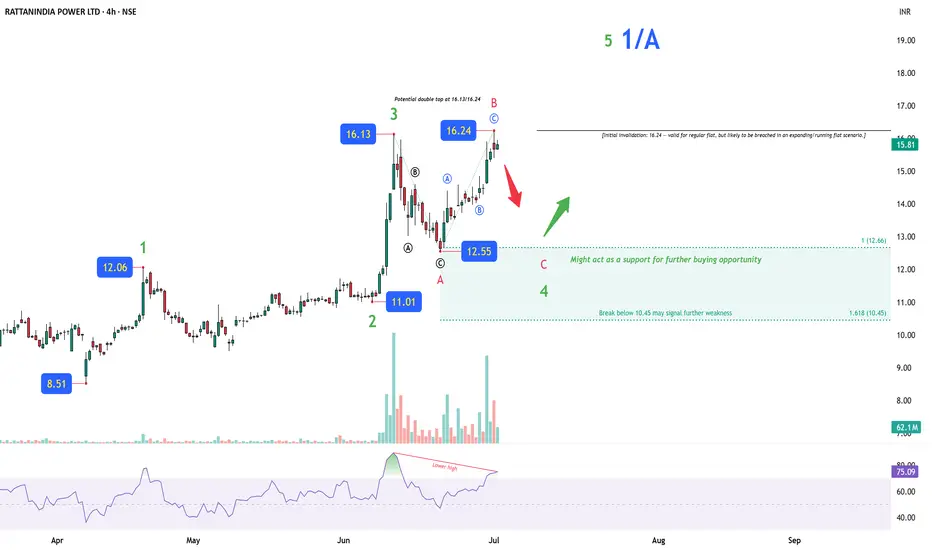
The current structure resembles a flat correction, forming after what appears to be a completed Wave 3. Price recently tagged a potential double top near ₹16.13/16.24, and bearish divergence is visible on the RSI—a classic warning sign. If this setup plays out, the stock could now be heading into a Wave C decline, unfolding in five legs, with key downside targets at ₹12.66 and ₹10.45.
That ₹10.45 level is critical—it marks the 1.618 extension of Wave A. A decisive break below it may signal broader weakness beyond just a flat correction.
Still, there is an alternate possibility. If price breaks above ₹16.24 with strong momentum and volume, the recent blue-marked ABC move might instead be the early legs of a new impulse wave. In that case, ₹12.55 could be reinterpreted as Wave 4, and the uptrend might continue. But without that breakout, the bearish setup holds more weight.
Disclaimer: This analysis is for educational purposes only and is not investment advice. Please do your own research or consult a financial advisor before making trading decisions.
WaveXplorer | Elliott Wave insights
📊 X profile: @veerappa89
📊 X profile: @veerappa89
Penafian
Maklumat dan penerbitan adalah tidak dimaksudkan untuk menjadi, dan tidak membentuk, nasihat untuk kewangan, pelaburan, perdagangan dan jenis-jenis lain atau cadangan yang dibekalkan atau disahkan oleh TradingView. Baca dengan lebih lanjut di Terma Penggunaan.