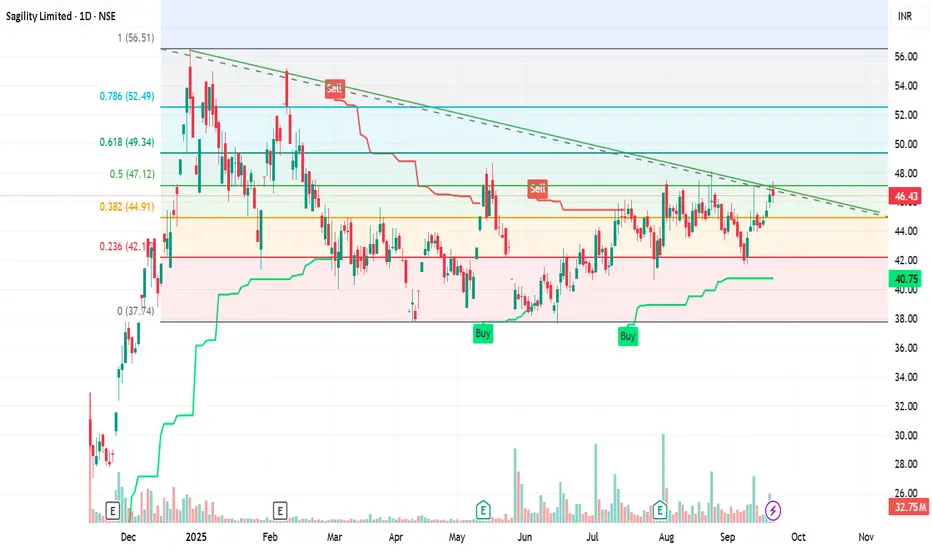
The chart of Sagility Limited on the NSE reveals a technically rich setup with several key signals. Here's a breakdown of what it indicates:
📉 Trend Analysis
- Descending Trendline: The stock has been forming lower highs, suggesting a downtrend or bearish sentiment.
- Current Price: ₹45.60, down 1.40% on the day—still trading below key resistance levels.
🔍 Fibonacci Retracement
- Levels like 0.236, 0.382, 0.5, 0.618, and 0.786 are plotted.
- These help identify potential reversal zones. If price breaks above the 0.382 or 0.5 level, it could signal a bullish retracement.
🟩🟥 Support & Resistance Zones
- Green shaded areas: Strong support zones where buyers may step in.
- Red shaded areas: Resistance zones where selling pressure could emerge.
- Price is currently hovering near a support zone—watch for a bounce or breakdown.
📊 Volume & Momentum
- Volume bars show moderate activity, but no major spikes—suggesting consolidation.
- The green line (likely a moving average) is sloping downward, reinforcing the bearish bias unless price crosses above it.
🟢🔴 Buy/Sell Signals
- Recent “Sell” signal near the descending trendline confirms weakness.
- Previous “Buy” signals occurred near support zones—if price approaches those again, it may offer a short-term opportunity.
🧠 What to Watch For
- Breakout above the descending trendline: Could trigger bullish momentum.
- Breakdown below support: May lead to further downside.
- Volume confirmation: A spike in volume with price movement adds conviction
🧠 Strategic Takeaways
- Bullish bias only above ₹47.25 with confirmation.
- Bearish continuation if ₹42.625 breaks.
- Gann levels align well with Fibonacci zones—giving confluence
Penafian
Maklumat dan penerbitan adalah tidak dimaksudkan untuk menjadi, dan tidak membentuk, nasihat untuk kewangan, pelaburan, perdagangan dan jenis-jenis lain atau cadangan yang dibekalkan atau disahkan oleh TradingView. Baca dengan lebih lanjut di Terma Penggunaan.
Penafian
Maklumat dan penerbitan adalah tidak dimaksudkan untuk menjadi, dan tidak membentuk, nasihat untuk kewangan, pelaburan, perdagangan dan jenis-jenis lain atau cadangan yang dibekalkan atau disahkan oleh TradingView. Baca dengan lebih lanjut di Terma Penggunaan.