Telah dikemas kini
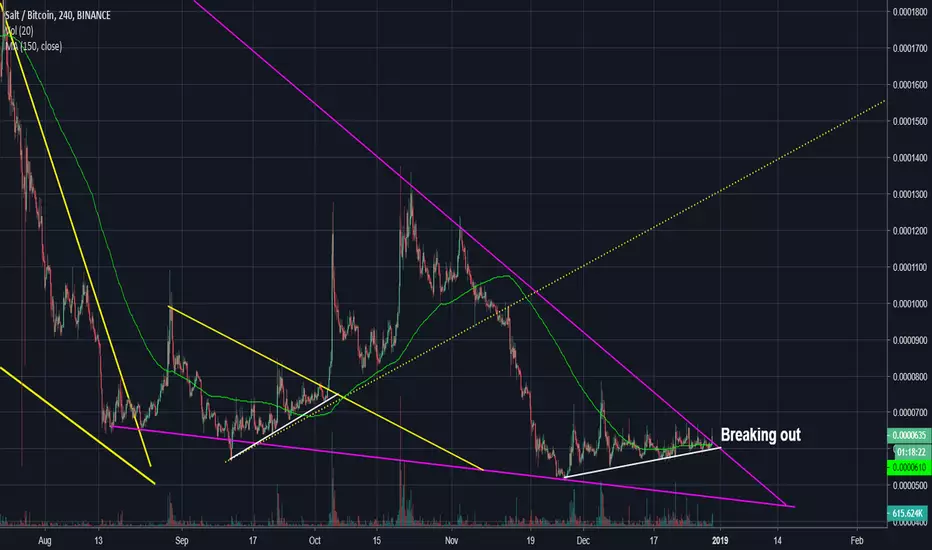
Salt - Breaking out! Lots of Potential

Looking at Salt's 4-hour chart, we can see it has been in an uptrend since late November and is currently testing the upper resistance boundary. It has already broken resistance and has since retraced. However, if the price takes off, there is a ton of potential.
Nota
Here's something interesting I found. OBV stands for On Balance Volume and the theory behind it is that volume precedes price. On this chart, you can see that while the price is hitting lower lows, the OBV is hitting higher highs. The white lines indicate the divergence in price and the OBV. This is a strong bullish indicator that the price will soon follow the volume.
Penafian
Maklumat dan penerbitan adalah tidak dimaksudkan untuk menjadi, dan tidak membentuk, nasihat untuk kewangan, pelaburan, perdagangan dan jenis-jenis lain atau cadangan yang dibekalkan atau disahkan oleh TradingView. Baca dengan lebih lanjut di Terma Penggunaan.
Penafian
Maklumat dan penerbitan adalah tidak dimaksudkan untuk menjadi, dan tidak membentuk, nasihat untuk kewangan, pelaburan, perdagangan dan jenis-jenis lain atau cadangan yang dibekalkan atau disahkan oleh TradingView. Baca dengan lebih lanjut di Terma Penggunaan.