Key Intraday Data:
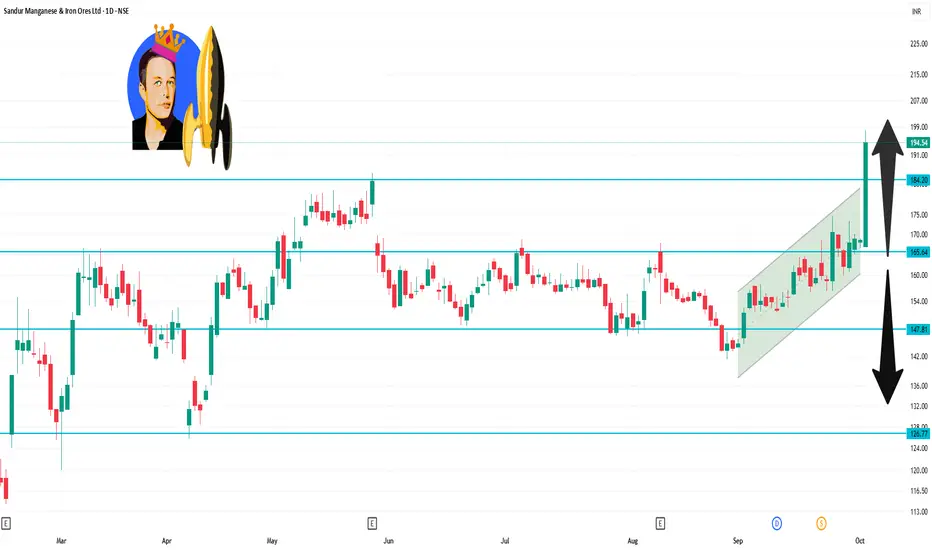
Opening Price: ₹167.00
Closing Price: ₹194.40
Day’s Range: ₹166.85 – ₹198.10
52-Week Range: ₹112.77 – ₹198.10
Volume Traded: Approximately 36.3 million shares
Market Capitalization: ₹9,457 crore
The stock closed at ₹194.40, marking a 15.34% increase from the previous close of ₹168.54. It also achieved a new 52-week high of ₹198.10 during the day.
Technical Indicators:
Technical analysis indicates a strong bullish trend for the stock. The Relative Strength Index (RSI) stands at 78.05, suggesting that the stock is approaching overbought territory.
Penerbitan berkaitan
Penafian
Maklumat dan penerbitan adalah tidak bertujuan, dan tidak membentuk, nasihat atau cadangan kewangan, pelaburan, dagangan atau jenis lain yang diberikan atau disahkan oleh TradingView. Baca lebih dalam Terma Penggunaan.
Penerbitan berkaitan
Penafian
Maklumat dan penerbitan adalah tidak bertujuan, dan tidak membentuk, nasihat atau cadangan kewangan, pelaburan, dagangan atau jenis lain yang diberikan atau disahkan oleh TradingView. Baca lebih dalam Terma Penggunaan.