SAPPHIRE FOODS - Bullish Breakout From Falling Wedge
📊 SAPPHIRE FOODS – Bullish Breakout from Falling Wedge
🕰️ Timeframe: 1D | 📉 Pattern: Falling Wedge Breakout
🔍 Technical Breakdown:
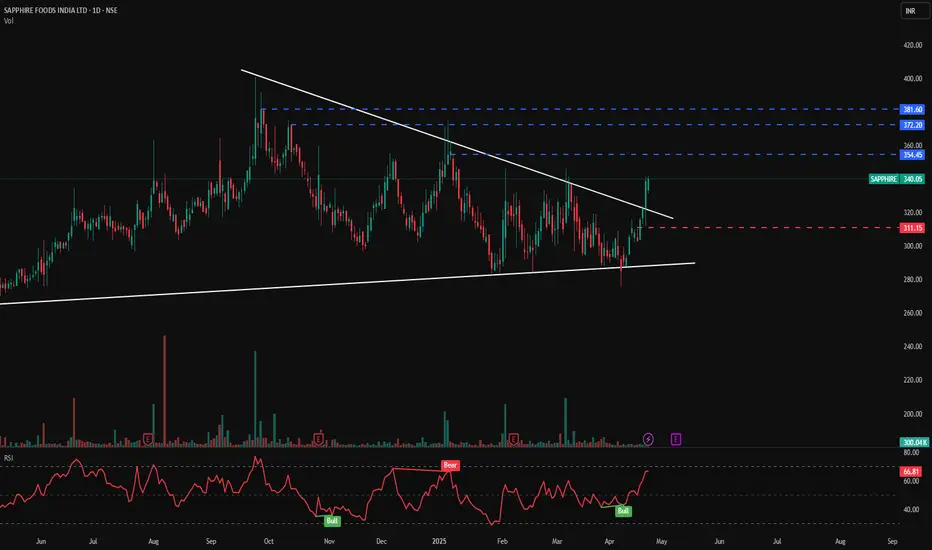
SAPPHIRE has broken out of a well-defined falling wedge pattern — a bullish reversal signal — backed by a sharp move on increased volume.
This wedge has been forming since early February, and the recent breakout above the upper trendline suggests renewed momentum and buying interest.
🔑 Key Technical Levels:
🔵 Resistance Zones (Upside Targets):
₹354.45
₹372.20
₹381.60
🔴 Support Zone:
₹311.15 (previous resistance turned support post-breakout)
⚪ Wedge Support Line: Well-held and now acting as a base for this breakout rally
📊 Volume & Indicator Insights:
🔺 Breakout is supported by a volume surge (300K), indicating institutional or smart money participation.
🔄 RSI at 66.81, nearing overbought territory but still in healthy uptrend range — confirming strength.
📉 RSI signals:
Bullish crossover (around ₹300) confirmed breakout
Prior “Bear” signal in Feb has now reversed to “Bull” (label shown)
🧠 Bias: Strongly Bullish
📍 Retest of ₹311–₹320 zone could offer re-entry opportunity with favorable risk-reward.
⚠️ Disclaimer: This chart is for educational purposes only. Please conduct your own due diligence or consult a professional before investing.
📈 Follow for more breakout pattern setups | PriceAction_Pulse
💬 Share your views on this wedge breakout in the comments!
🕰️ Timeframe: 1D | 📉 Pattern: Falling Wedge Breakout
🔍 Technical Breakdown:
SAPPHIRE has broken out of a well-defined falling wedge pattern — a bullish reversal signal — backed by a sharp move on increased volume.
This wedge has been forming since early February, and the recent breakout above the upper trendline suggests renewed momentum and buying interest.
🔑 Key Technical Levels:
🔵 Resistance Zones (Upside Targets):
₹354.45
₹372.20
₹381.60
🔴 Support Zone:
₹311.15 (previous resistance turned support post-breakout)
⚪ Wedge Support Line: Well-held and now acting as a base for this breakout rally
📊 Volume & Indicator Insights:
🔺 Breakout is supported by a volume surge (300K), indicating institutional or smart money participation.
🔄 RSI at 66.81, nearing overbought territory but still in healthy uptrend range — confirming strength.
📉 RSI signals:
Bullish crossover (around ₹300) confirmed breakout
Prior “Bear” signal in Feb has now reversed to “Bull” (label shown)
🧠 Bias: Strongly Bullish
📍 Retest of ₹311–₹320 zone could offer re-entry opportunity with favorable risk-reward.
⚠️ Disclaimer: This chart is for educational purposes only. Please conduct your own due diligence or consult a professional before investing.
📈 Follow for more breakout pattern setups | PriceAction_Pulse
💬 Share your views on this wedge breakout in the comments!
Dagangan ditutup: hentian tercapai
Penafian
The information and publications are not meant to be, and do not constitute, financial, investment, trading, or other types of advice or recommendations supplied or endorsed by TradingView. Read more in the Terms of Use.
Penafian
The information and publications are not meant to be, and do not constitute, financial, investment, trading, or other types of advice or recommendations supplied or endorsed by TradingView. Read more in the Terms of Use.