SBFC Finance ltd
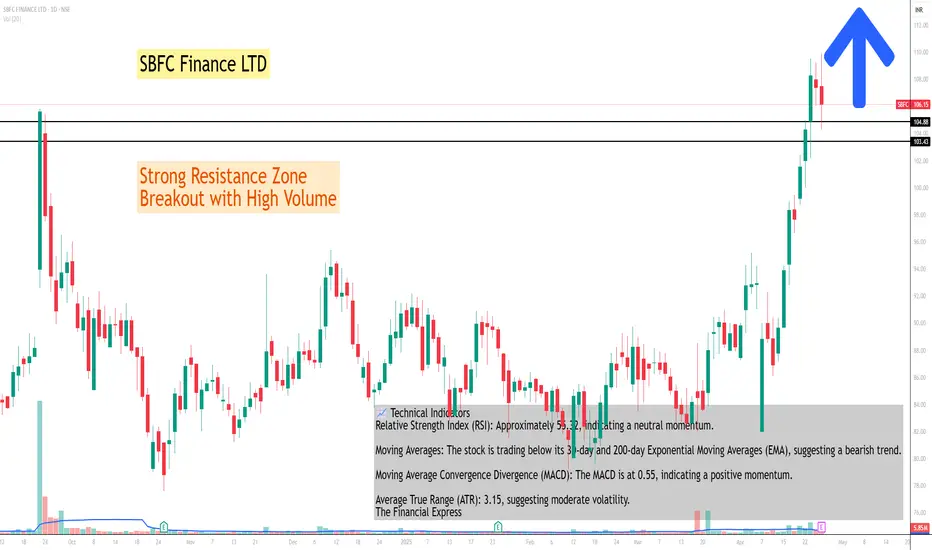
📈 Technical Indicators
Relative Strength Index (RSI): Approximately 55.32, indicating a neutral momentum.
Moving Averages: The stock is trading below its 30-day and 200-day Exponential Moving Averages (EMA), suggesting a bearish trend.
Moving Average Convergence Divergence (MACD): The MACD is at 0.55, indicating a positive momentum.
Average True Range (ATR): 3.15, suggesting moderate volatility.
The Financial Express
🔍 Observations
The stock is currently trading below its key moving averages, which may indicate a bearish trend. However, the positive MACD and neutral RSI suggest potential for upward movement if the stock breaks above resistance levels. Traders should monitor the stock's price action around the pivot point of ₹89.48 and the resistance levels at ₹92.32, ₹94.01, and ₹96.85.
Please note that technical analysis is subject to market conditions and should be used in conjunction with other forms of analysis.
Penerbitan berkaitan
Penafian
Maklumat dan penerbitan adalah tidak dimaksudkan untuk menjadi, dan tidak membentuk, nasihat untuk kewangan, pelaburan, perdagangan dan jenis-jenis lain atau cadangan yang dibekalkan atau disahkan oleh TradingView. Baca dengan lebih lanjut di Terma Penggunaan.
Penerbitan berkaitan
Penafian
Maklumat dan penerbitan adalah tidak dimaksudkan untuk menjadi, dan tidak membentuk, nasihat untuk kewangan, pelaburan, perdagangan dan jenis-jenis lain atau cadangan yang dibekalkan atau disahkan oleh TradingView. Baca dengan lebih lanjut di Terma Penggunaan.