🏦 SBI LIFE INSURANCE CO LTD – Breakout with Bullish Engulfing Confirmation | Daily Chart
📅 Date: April 28, 2025
📈 Timeframe: Daily Chart
🔍 Stock: SBI Life Insurance Co Ltd (NSE)
📌 Technical Overview:
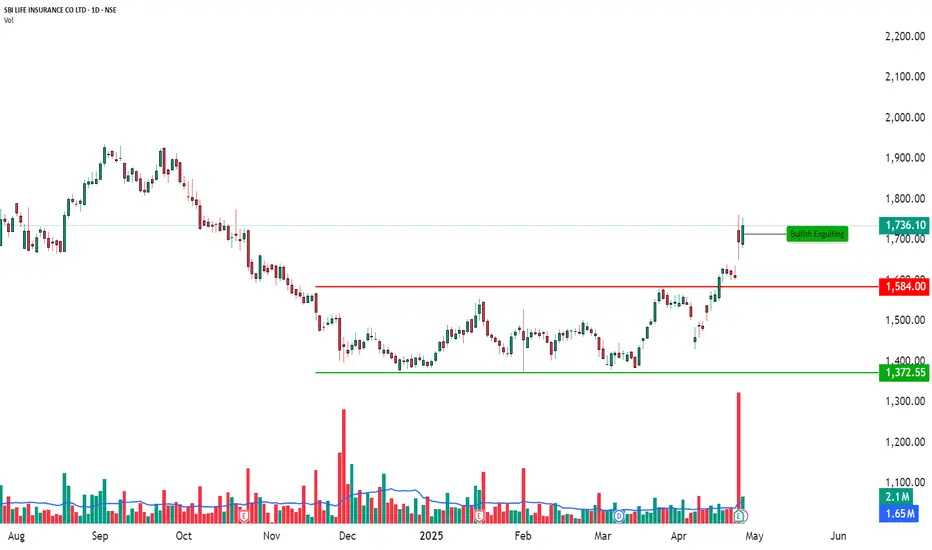
SBI Life is showing strong bullish momentum on the daily chart after breaking out above a key horizontal resistance around ₹1,584.
The price has formed a Bullish Engulfing candlestick pattern, indicating renewed buyer strength, backed by heavy volume.
🧩 Chart Pattern:
Strong horizontal resistance at ₹1,584 (now acting as support).
Bullish Engulfing candle printed around ₹1,736.10, showing strong rejection of lower levels.
Price structure continues to maintain higher highs and higher lows – a positive sign for bulls.
🔍 Key Price Levels:
Support Zones: ₹1,584(marked in red)
Major Support: ₹1,372.55(green horizontal line)
Current Market Price (CMP): ₹1,736.10
A sustained move above ₹1,736 with rising volume could potentially take the stock towards higher psychological levels around ₹1,800+.
📊 Volume Analysis:
Strong volume breakout observed during the recent rally.
Volume spike supports the validity of the bullish breakout, indicating increased buying interest.
🧠 Observational Bias:
As long as SBI Life holds above ₹1,584, the short-term to medium-term bias remains positively bullish. Any healthy pullbacks near ₹1,580–₹1,600 zones could offer better risk-reward setups for positional traders.
📅 Date: April 28, 2025
📈 Timeframe: Daily Chart
🔍 Stock: SBI Life Insurance Co Ltd (NSE)
📌 Technical Overview:
SBI Life is showing strong bullish momentum on the daily chart after breaking out above a key horizontal resistance around ₹1,584.
The price has formed a Bullish Engulfing candlestick pattern, indicating renewed buyer strength, backed by heavy volume.
🧩 Chart Pattern:
Strong horizontal resistance at ₹1,584 (now acting as support).
Bullish Engulfing candle printed around ₹1,736.10, showing strong rejection of lower levels.
Price structure continues to maintain higher highs and higher lows – a positive sign for bulls.
🔍 Key Price Levels:
Support Zones: ₹1,584(marked in red)
Major Support: ₹1,372.55(green horizontal line)
Current Market Price (CMP): ₹1,736.10
A sustained move above ₹1,736 with rising volume could potentially take the stock towards higher psychological levels around ₹1,800+.
📊 Volume Analysis:
Strong volume breakout observed during the recent rally.
Volume spike supports the validity of the bullish breakout, indicating increased buying interest.
🧠 Observational Bias:
As long as SBI Life holds above ₹1,584, the short-term to medium-term bias remains positively bullish. Any healthy pullbacks near ₹1,580–₹1,600 zones could offer better risk-reward setups for positional traders.
STWP | Mentor & Demand-Supply Specialist | Empowering traders through structured learning |
simpletradewithpatience.com
Community: chat.whatsapp.com/BEYz0tkqP0fJPBCWf59uel
wa.me/message/6IOPHGOXMGZ4N1
Educational Only
simpletradewithpatience.com
Community: chat.whatsapp.com/BEYz0tkqP0fJPBCWf59uel
wa.me/message/6IOPHGOXMGZ4N1
Educational Only
Penafian
Maklumat dan penerbitan adalah tidak bertujuan, dan tidak membentuk, nasihat atau cadangan kewangan, pelaburan, dagangan atau jenis lain yang diberikan atau disahkan oleh TradingView. Baca lebih dalam Terma Penggunaan.