Weekly Chart View
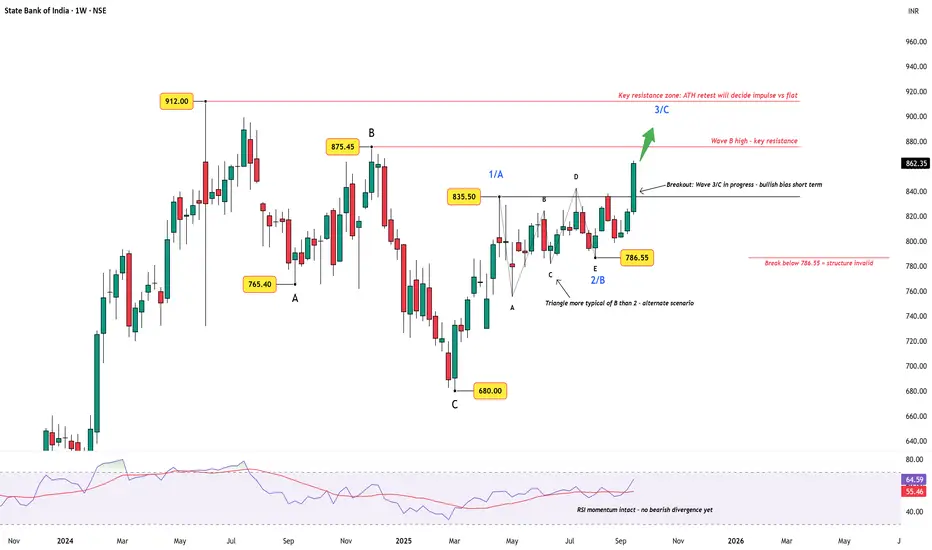
State Bank of India has staged a strong breakout above the consolidation zone near ₹835, with weekly RSI showing healthy momentum and no bearish divergence yet. This breakout suggests that Wave 3/C is in progress, keeping the short-term outlook bullish.
Key Observations:
Summary:
The bias remains bullish in the short term, but this rally will be tested at the higher resistance levels. If the stock pushes through the ATH, we may confirm an impulsive sequence. If not, a 3-3-5 flat could be in play. Either way, this is a key checkpoint zone for SBI.
Disclaimer: This analysis is for educational purposes only and does not constitute investment advice. Please do your own research (DYOR) before making any trading decisions.
State Bank of India has staged a strong breakout above the consolidation zone near ₹835, with weekly RSI showing healthy momentum and no bearish divergence yet. This breakout suggests that Wave 3/C is in progress, keeping the short-term outlook bullish.
Key Observations:
- Wave 2/B: The recent sideways move looks like a triangle. While triangles are unusual for Wave 2, they are common in Wave B — raising the possibility that this could be part of a larger corrective flat.
- Resistance Levels: Immediate resistance sits at the Wave B high (₹875.45), followed by the all-time high (₹912). The ATH retest will be critical in determining whether the structure continues impulsively or morphs into a flat.
- Support & Invalidation: The breakout remains valid as long as price stays above ₹786.55 (Wave 2/B low). A decisive break below this level would invalidate the current bullish structure and force reevaluation.
- Momentum: RSI is supportive, showing strength and no sign of divergence yet.
Summary:
The bias remains bullish in the short term, but this rally will be tested at the higher resistance levels. If the stock pushes through the ATH, we may confirm an impulsive sequence. If not, a 3-3-5 flat could be in play. Either way, this is a key checkpoint zone for SBI.
Disclaimer: This analysis is for educational purposes only and does not constitute investment advice. Please do your own research (DYOR) before making any trading decisions.
Dagangan ditutup: sasaran tercapai
WaveXplorer | Elliott Wave insights
📊 X profile: @veerappa89
📊 X profile: @veerappa89
Penerbitan berkaitan
Penafian
The information and publications are not meant to be, and do not constitute, financial, investment, trading, or other types of advice or recommendations supplied or endorsed by TradingView. Read more in the Terms of Use.