Detailed Market Structure Breakdown
4-Hour Chart (Macro Trend)
Structure: The Sensex is now in a Corrective Phase, having broken the lower trendline of the aggressive ascending channel and closing below the critical 83,600 support. The price is trending lower within a descending channel.
Key Levels:
Major Supply (Resistance): 84,200 - 84,400. This area (the breakdown level and previous FVG) is the key overhead resistance. A "Sell on Rise" strategy is favored in this zone.
Major Demand (Support): 82,900 - 83,200. This is the most critical support zone, aligning with the lowest point of the previous correction and a major FVG (Fair Value Gap).
Outlook: The short-term bias is Bearish. A breakdown below 83,300 would trigger a deeper correction towards 82,900.
1-Hour Chart (Intermediate View)
Structure: The 1H chart is strongly bearish, trading in a well-defined descending channel, confirming the short-term correction. The market is making lower lows and lower highs, and the price closed near the channel's lower boundary.
Key Levels:
Immediate Resistance: 83,600 (Upper boundary of the descending channel).
Immediate Support: 83,200 (Lower boundary of the descending channel).
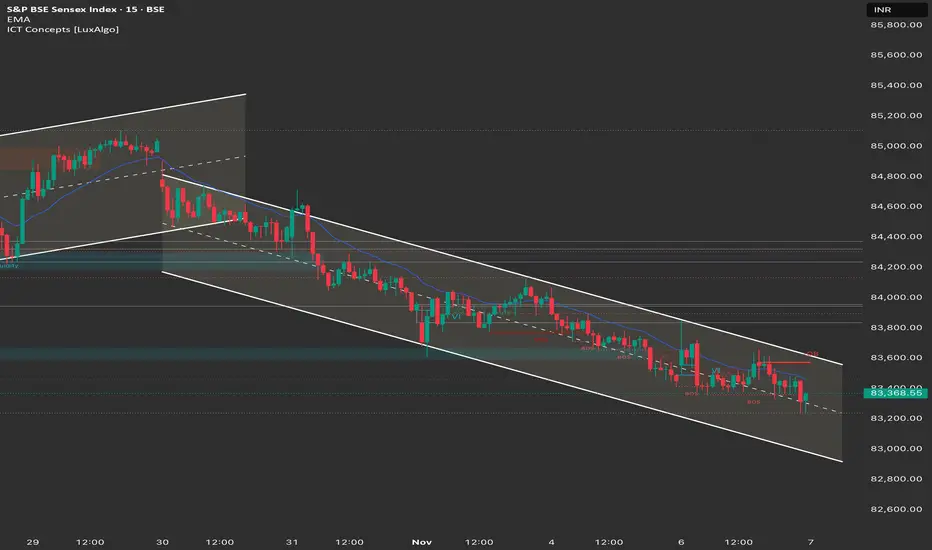
15-Minute Chart (Intraday View)
Structure: The 15M chart confirms the steep descending channel and strong intraday bearish control. The market is making lower highs and lower lows, closing with a small bearish candle.
Key Levels:
Intraday Supply: 83,600.
Intraday Demand: 83,200.
Outlook: Strongly Bearish.
📈 Structure Analysis & Trade Plan: 7th November
Market Outlook: The Sensex is in a strong bearish trend, with the structure favoring continuation towards major support at 83,200. The overall strategy is Sell on Rise or Breakdown.
Bearish Scenario (Primary Plan: Correction Continuation/Sell on Rise)
Justification: The breakdown below 83,600 and the confirmed descending channel favor continuation toward the macro support.
Entry: Short entry on a successful retest and rejection of the 83,600 - 83,800 level (upper channel resistance/FVG) OR Short on a decisive break and 15-minute candle close below 83,200.
Stop Loss (SL): Place a stop loss above 84,000 (above the immediate swing high).
Targets:
T1: 83,200 (Lower channel support/Major FVG).
T2: 82,900 (Next major demand zone).
Bullish Scenario (Counter-Trend/Reversal)
Justification: A short-covering bounce is possible if the market aggressively reclaims the channel.
Trigger: A sustained move and close above 84,000.
Entry: Long entry on a confirmed 15-minute close above 84,000.
Stop Loss (SL): Below 83,600.
Targets:
T1: 84,200 (Major overhead resistance).
T2: 84,400 (Previous swing high).
Key Levels for Observation:
Immediate Decision Point: 83,200 - 83,600 zone.
Bearish Confirmation: Sustained trade below 83,200.
Bullish Confirmation: A move back above 84,000.
Line in the Sand: 83,600. Below this, the trend is strongly bearish.
4-Hour Chart (Macro Trend)
Structure: The Sensex is now in a Corrective Phase, having broken the lower trendline of the aggressive ascending channel and closing below the critical 83,600 support. The price is trending lower within a descending channel.
Key Levels:
Major Supply (Resistance): 84,200 - 84,400. This area (the breakdown level and previous FVG) is the key overhead resistance. A "Sell on Rise" strategy is favored in this zone.
Major Demand (Support): 82,900 - 83,200. This is the most critical support zone, aligning with the lowest point of the previous correction and a major FVG (Fair Value Gap).
Outlook: The short-term bias is Bearish. A breakdown below 83,300 would trigger a deeper correction towards 82,900.
1-Hour Chart (Intermediate View)
Structure: The 1H chart is strongly bearish, trading in a well-defined descending channel, confirming the short-term correction. The market is making lower lows and lower highs, and the price closed near the channel's lower boundary.
Key Levels:
Immediate Resistance: 83,600 (Upper boundary of the descending channel).
Immediate Support: 83,200 (Lower boundary of the descending channel).
15-Minute Chart (Intraday View)
Structure: The 15M chart confirms the steep descending channel and strong intraday bearish control. The market is making lower highs and lower lows, closing with a small bearish candle.
Key Levels:
Intraday Supply: 83,600.
Intraday Demand: 83,200.
Outlook: Strongly Bearish.
📈 Structure Analysis & Trade Plan: 7th November
Market Outlook: The Sensex is in a strong bearish trend, with the structure favoring continuation towards major support at 83,200. The overall strategy is Sell on Rise or Breakdown.
Bearish Scenario (Primary Plan: Correction Continuation/Sell on Rise)
Justification: The breakdown below 83,600 and the confirmed descending channel favor continuation toward the macro support.
Entry: Short entry on a successful retest and rejection of the 83,600 - 83,800 level (upper channel resistance/FVG) OR Short on a decisive break and 15-minute candle close below 83,200.
Stop Loss (SL): Place a stop loss above 84,000 (above the immediate swing high).
Targets:
T1: 83,200 (Lower channel support/Major FVG).
T2: 82,900 (Next major demand zone).
Bullish Scenario (Counter-Trend/Reversal)
Justification: A short-covering bounce is possible if the market aggressively reclaims the channel.
Trigger: A sustained move and close above 84,000.
Entry: Long entry on a confirmed 15-minute close above 84,000.
Stop Loss (SL): Below 83,600.
Targets:
T1: 84,200 (Major overhead resistance).
T2: 84,400 (Previous swing high).
Key Levels for Observation:
Immediate Decision Point: 83,200 - 83,600 zone.
Bearish Confirmation: Sustained trade below 83,200.
Bullish Confirmation: A move back above 84,000.
Line in the Sand: 83,600. Below this, the trend is strongly bearish.
Penafian
Maklumat dan penerbitan adalah tidak bertujuan, dan tidak membentuk, nasihat atau cadangan kewangan, pelaburan, dagangan atau jenis lain yang diberikan atau disahkan oleh TradingView. Baca lebih dalam Terma Penggunaan.
Penafian
Maklumat dan penerbitan adalah tidak bertujuan, dan tidak membentuk, nasihat atau cadangan kewangan, pelaburan, dagangan atau jenis lain yang diberikan atau disahkan oleh TradingView. Baca lebih dalam Terma Penggunaan.