🔹 4H Chart (Swing Bias)
Trend: Still bearish; lower highs and lower lows intact inside a descending channel.
FVG Supply: Around 81,600–81,800 remains untested and acts as a strong supply cap.
Recent Reaction: Price rejected sharply from ~80,600 (near 20 EMA & supply).
Demand Zone: 79,800–79,600 (highlighted green box) is the last demand block; defended intraday but being retested.
✅ Bias: Bearish to sideways
Resistance: 80,600–80,800
Demand: 79,800–79,600
🔹 1H Chart (Intraday Bias)
Breakdown: Price lost 20 EMA and structure after retesting 80,600.
FVG: Fresh bearish FVG between 80,400–80,600 → short re-entry zone.
Support: Demand block at 79,800–79,600 is holding for now, but repeated testing weakens it.
Channel: Price is respecting downward sloping channel resistance.
✅ Bias: Bearish with possible pullback
Short re-entry: 80,400–80,600 (FVG & channel resistance)
Targets: 80,000 / 79,800 → 79,600
SL: Above 80,800
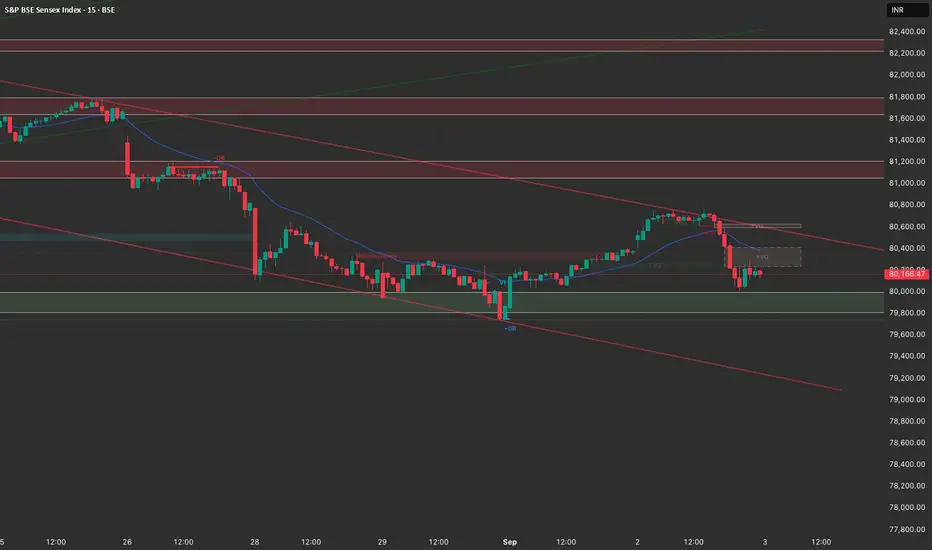
🔹 15m Chart (Execution View)
Order Flow: Break of market structure (BOS) at 80,300; sellers stepped in aggressively.
OB + FVG: Overlapping bearish order block & FVG at 80,400–80,600 = ideal short zone.
Liquidity: Sell-side liquidity resting below 79,800 → likely sweep area.
✅ Trade Plan for Tomorrow (3rd Sept):
Primary Setup (Short Bias):
Look for rejection / bearish PA at 80,400–80,600.
Short entry in that zone.
Targets: 80,000 → 79,800 → 79,600.
Stop loss: Above 80,800.
Alternate Bullish Scenario (if 79,800 demand holds with strong reversal):
Buy only after clean BOS above 80,600.
Target: 81,000–81,200.
But probability lower while within channel.
📌 Summary:
Sensex structure is still bearish, with rallies into 80,400–80,600 likely to get sold into. Tomorrow’s trade should be sell on rise unless price gives a strong breakout above 80,800 (invalidating the bearish structure). Watch 79,800–79,600 carefully; a clean breakdown can accelerate fall toward 79,200–79,000.
Trend: Still bearish; lower highs and lower lows intact inside a descending channel.
FVG Supply: Around 81,600–81,800 remains untested and acts as a strong supply cap.
Recent Reaction: Price rejected sharply from ~80,600 (near 20 EMA & supply).
Demand Zone: 79,800–79,600 (highlighted green box) is the last demand block; defended intraday but being retested.
✅ Bias: Bearish to sideways
Resistance: 80,600–80,800
Demand: 79,800–79,600
🔹 1H Chart (Intraday Bias)
Breakdown: Price lost 20 EMA and structure after retesting 80,600.
FVG: Fresh bearish FVG between 80,400–80,600 → short re-entry zone.
Support: Demand block at 79,800–79,600 is holding for now, but repeated testing weakens it.
Channel: Price is respecting downward sloping channel resistance.
✅ Bias: Bearish with possible pullback
Short re-entry: 80,400–80,600 (FVG & channel resistance)
Targets: 80,000 / 79,800 → 79,600
SL: Above 80,800
🔹 15m Chart (Execution View)
Order Flow: Break of market structure (BOS) at 80,300; sellers stepped in aggressively.
OB + FVG: Overlapping bearish order block & FVG at 80,400–80,600 = ideal short zone.
Liquidity: Sell-side liquidity resting below 79,800 → likely sweep area.
✅ Trade Plan for Tomorrow (3rd Sept):
Primary Setup (Short Bias):
Look for rejection / bearish PA at 80,400–80,600.
Short entry in that zone.
Targets: 80,000 → 79,800 → 79,600.
Stop loss: Above 80,800.
Alternate Bullish Scenario (if 79,800 demand holds with strong reversal):
Buy only after clean BOS above 80,600.
Target: 81,000–81,200.
But probability lower while within channel.
📌 Summary:
Sensex structure is still bearish, with rallies into 80,400–80,600 likely to get sold into. Tomorrow’s trade should be sell on rise unless price gives a strong breakout above 80,800 (invalidating the bearish structure). Watch 79,800–79,600 carefully; a clean breakdown can accelerate fall toward 79,200–79,000.
Penafian
Maklumat dan penerbitan adalah tidak dimaksudkan untuk menjadi, dan tidak membentuk, nasihat untuk kewangan, pelaburan, perdagangan dan jenis-jenis lain atau cadangan yang dibekalkan atau disahkan oleh TradingView. Baca dengan lebih lanjut di Terma Penggunaan.
Penafian
Maklumat dan penerbitan adalah tidak dimaksudkan untuk menjadi, dan tidak membentuk, nasihat untuk kewangan, pelaburan, perdagangan dan jenis-jenis lain atau cadangan yang dibekalkan atau disahkan oleh TradingView. Baca dengan lebih lanjut di Terma Penggunaan.