📉 Weekly Technical Overview (as of Sep 26, 2025)
Current Level: Approximately 80,782.73 points
Weekly Decline: ~2,000 points, reflecting a drop of about 2.35%
Technical Indicators:
Relative Strength Index (RSI): The RSI is currently in the oversold zone, indicating potential for a short-term rebound if buying interest returns
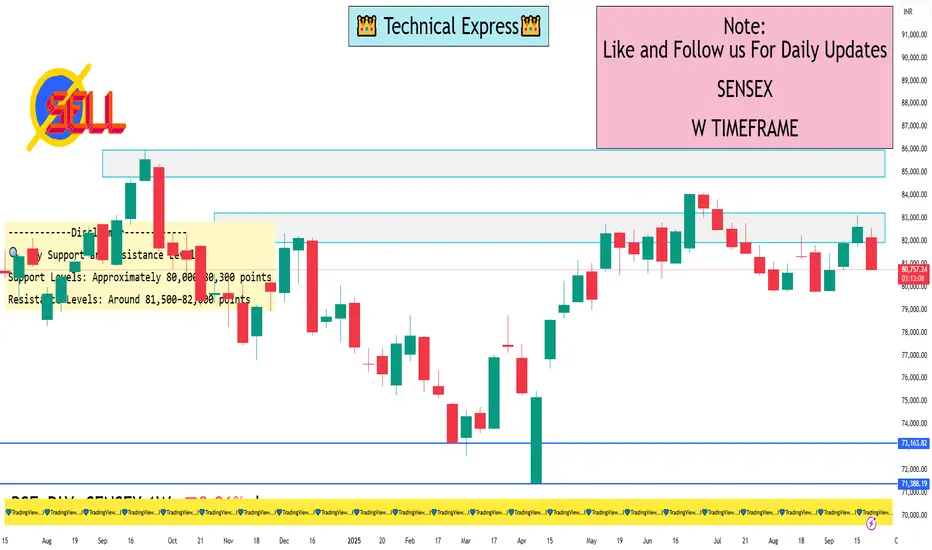
Moving Averages: Technical analysis suggests a bearish trend, with moving averages signaling a "strong sell" outlook
Pivot Points: Key support and resistance levels are being closely monitored to gauge potential reversal points
🔍 Key Support and Resistance Levels
Support Levels: Approximately 80,000–80,300 points
Resistance Levels: Around 81,500–82,000 points
These levels are crucial for determining the market's short-term direction. A break below support may indicate further downside, while a move above resistance could signal a potential recovery.
📈 Outlook
While the short-term technical indicators suggest a bearish trend, the oversold conditions and key support levels imply that the market may be due for a corrective bounce. However, the ongoing geopolitical tensions and trade-related uncertainties could continue to exert downward pressure on the index.
Investors are advised to monitor the upcoming trading sessions closely, as a decisive move above or below the established support and resistance levels could provide clearer signals for the next phase of market movement.
Current Level: Approximately 80,782.73 points
Weekly Decline: ~2,000 points, reflecting a drop of about 2.35%
Technical Indicators:
Relative Strength Index (RSI): The RSI is currently in the oversold zone, indicating potential for a short-term rebound if buying interest returns
Moving Averages: Technical analysis suggests a bearish trend, with moving averages signaling a "strong sell" outlook
Pivot Points: Key support and resistance levels are being closely monitored to gauge potential reversal points
🔍 Key Support and Resistance Levels
Support Levels: Approximately 80,000–80,300 points
Resistance Levels: Around 81,500–82,000 points
These levels are crucial for determining the market's short-term direction. A break below support may indicate further downside, while a move above resistance could signal a potential recovery.
📈 Outlook
While the short-term technical indicators suggest a bearish trend, the oversold conditions and key support levels imply that the market may be due for a corrective bounce. However, the ongoing geopolitical tensions and trade-related uncertainties could continue to exert downward pressure on the index.
Investors are advised to monitor the upcoming trading sessions closely, as a decisive move above or below the established support and resistance levels could provide clearer signals for the next phase of market movement.
I built a Buy & Sell Signal Indicator with 85% accuracy.
📈 Get access via DM or
WhatsApp: wa.link/d997q0
| Email: techncialexpress@gmail.com
| Script Coder | Trader | Investor | From India
📈 Get access via DM or
WhatsApp: wa.link/d997q0
| Email: techncialexpress@gmail.com
| Script Coder | Trader | Investor | From India
Penerbitan berkaitan
Penafian
Maklumat dan penerbitan adalah tidak dimaksudkan untuk menjadi, dan tidak membentuk, nasihat untuk kewangan, pelaburan, perdagangan dan jenis-jenis lain atau cadangan yang dibekalkan atau disahkan oleh TradingView. Baca dengan lebih lanjut di Terma Penggunaan.