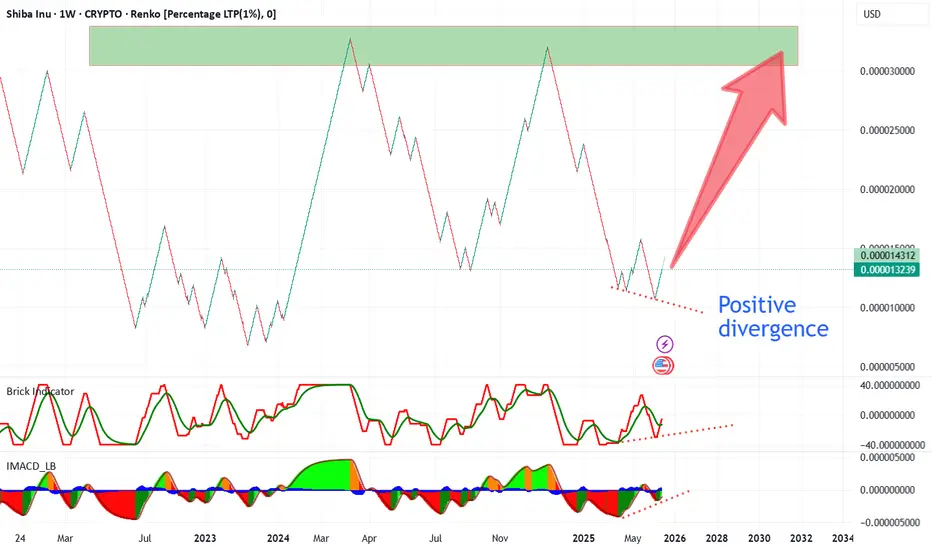
Positive divergence detected!
On the weekly SHIBUSD chart (Renko, %), we see a clear positive divergence between price action and both the Brick Indicator and MACD. While the price printed new lows, momentum indicators are forming higher lows, suggesting fading bearish pressure and a possible reversal ahead.
Key Resistance / Target:
The main resistance zone is at 0.000032 USD (highlighted in green on the chart). This level marks a strong supply area from previous cycles and serves as a potential upside target if the bullish momentum continues.
Summary:
Positive divergence on momentum indicators is confirmed.
Bearish trend is losing strength; reversal potential is increasing.
Next key target is the 0.000032 USD resistance area.
⚠️ This analysis is for informational purposes only and is not financial advice. Always DYOR before trading.
For more of my on-chain analyses, visit my CryptoQuant profile:
cryptoquant.com/profile/u/CryptoOnchain?tab=quicktake
cryptoquant.com/profile/u/CryptoOnchain?tab=quicktake
Penafian
Maklumat dan penerbitan adalah tidak dimaksudkan untuk menjadi, dan tidak membentuk, nasihat untuk kewangan, pelaburan, perdagangan dan jenis-jenis lain atau cadangan yang dibekalkan atau disahkan oleh TradingView. Baca dengan lebih lanjut di Terma Penggunaan.