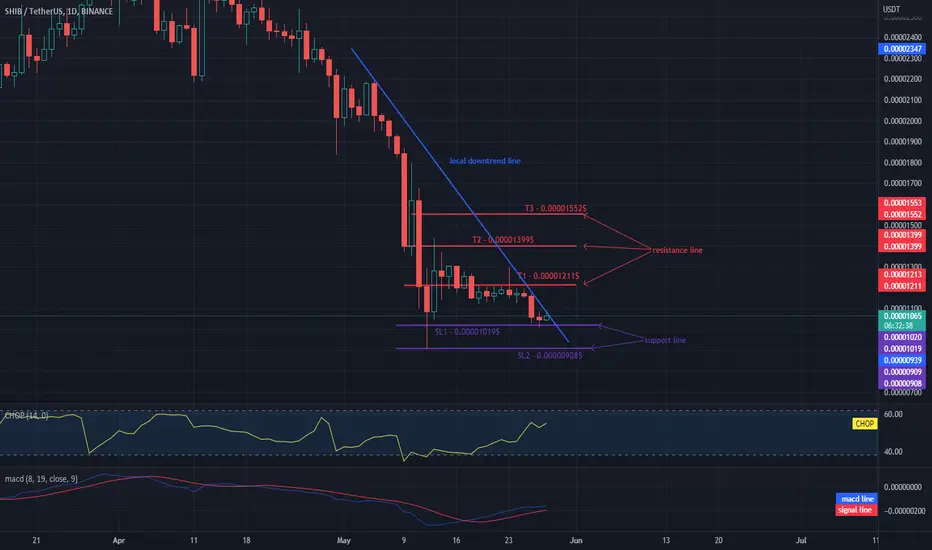
Hello everyone, let's take a look at the SHIB to USDT chart on a 1 day time frame. As you can see, the price is moving below the local downtrend line and is approaching its side exit.
It is worth starting with setting a stop loss, which we should take into account in the coming hours. As you can see, we chose 4 stop losses:
SL1 - $ 0.00001170,
SL2 - $ 0.00001109,
Now let's move on to defining the goals of price and as you can see, the first is at the T1 level - $ 0.00001211, which the price is currently struggling with, the next is at the T2 - $ 0.00001399 level, the next is T3 - $ 0.00001552.
Looking at the CHOP indicator, we can see that we collect more and more energy in the 1-day interval, and the MACD indicator does not indicate a downward trend.
Penafian
Maklumat dan penerbitan adalah tidak dimaksudkan untuk menjadi, dan tidak membentuk, nasihat untuk kewangan, pelaburan, perdagangan dan jenis-jenis lain atau cadangan yang dibekalkan atau disahkan oleh TradingView. Baca dengan lebih lanjut di Terma Penggunaan.
Penafian
Maklumat dan penerbitan adalah tidak dimaksudkan untuk menjadi, dan tidak membentuk, nasihat untuk kewangan, pelaburan, perdagangan dan jenis-jenis lain atau cadangan yang dibekalkan atau disahkan oleh TradingView. Baca dengan lebih lanjut di Terma Penggunaan.