Shiba Inu (SHIB) technical analysis:
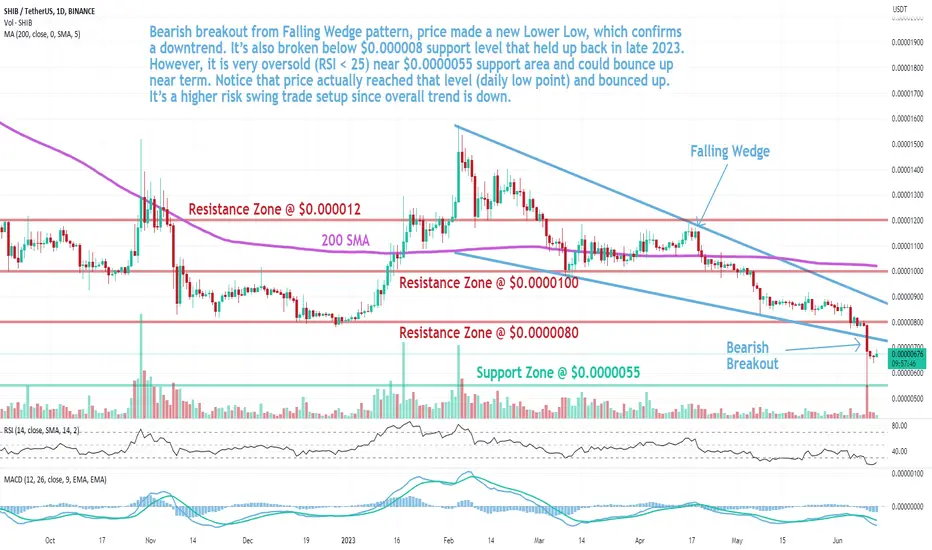
Trade setup: Bearish breakout from Falling Wedge pattern, price made a new Lower Low, which confirms a downtrend. It’s also broken below $0.000008 support level that held up back in late 2023. However, it is very oversold (RSI < 25) near $0.0000055 support area and could bounce up near term. Notice that price actually reached that level (daily low point) and bounced up. It’s a higher risk swing trade setup since overall trend is down.
Trend: Downtrend across all time horizons (Short- Medium- and Long-Term).
Momentum is Bearish (MACD Line is below MACD Signal Line, and RSI is below 45).
Support and Resistance: Nearest Support Zone is $0.0000055. The nearest Resistance Zone is $0.0000080 (previous support), then $0.0000100, and $0.00001200.
Penafian
Maklumat dan penerbitan adalah tidak dimaksudkan untuk menjadi, dan tidak membentuk, nasihat untuk kewangan, pelaburan, perdagangan dan jenis-jenis lain atau cadangan yang dibekalkan atau disahkan oleh TradingView. Baca dengan lebih lanjut di Terma Penggunaan.
Penafian
Maklumat dan penerbitan adalah tidak dimaksudkan untuk menjadi, dan tidak membentuk, nasihat untuk kewangan, pelaburan, perdagangan dan jenis-jenis lain atau cadangan yang dibekalkan atau disahkan oleh TradingView. Baca dengan lebih lanjut di Terma Penggunaan.