🧠 Overview:
SHIBA/USDT is once again testing a critical support zone that has held strong since early 2022. This area isn’t just a technical level — it represents a long-term accumulation zone where buyers have consistently stepped in.
What happens next could define SHIB's mid to long-term trend. Will we see a major bullish reversal, or is a breakdown and deeper correction looming?
---
📊 Technical Breakdown:
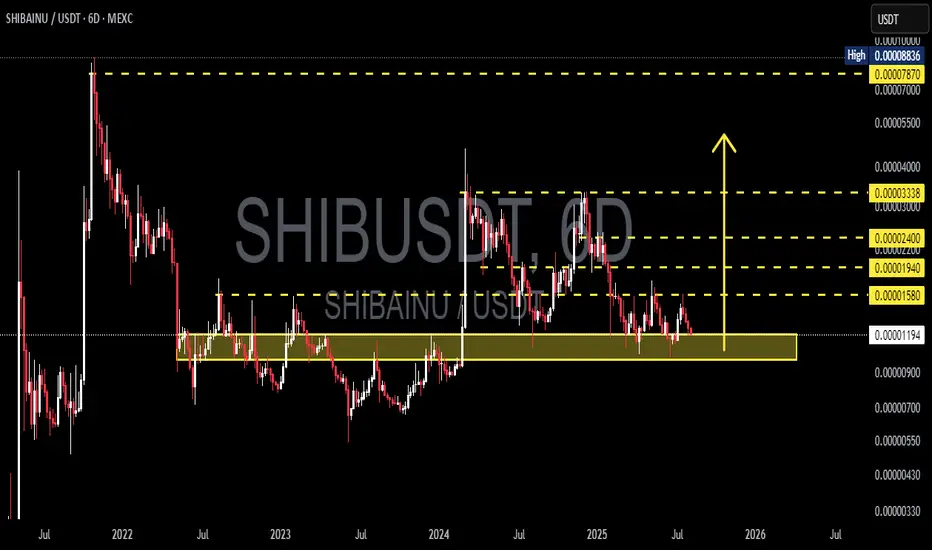
Key Demand Zone (Major Support):
🔸 0.00001090 – 0.00001190 USDT
This zone has been tested multiple times over the past two years. It remains the last major stronghold for bulls. A breakdown here could trigger panic selling.
Important Resistance Levels (Bullish Targets):
🔹 0.00001580 → Initial resistance
🔹 0.00001940 → Previous distribution area
🔹 0.00002400 → Strong psychological level
🔹 0.00003338 → Mid-term bullish target
🔹 0.00007870 – 0.00008836 → High timeframe supply zone and potential long-term profit-taking area
Market Structure:
🔸 Price remains inside a long-term horizontal consolidation range
🔸 No clear breakout yet, but early signs of buyer interest are forming
🔸 Possibility of forming a double bottom or accumulation breakout if bullish momentum strengthens
---
📈 Bullish Scenario:
✅ Price holds above 0.00001190 support
✅ Breakout above 0.00001580 = early trend reversal signal
✅ Bullish confirmation with volume increase
✅ Mid-term targets: 0.00001940 → 0.00002400 → 0.00003338
✅ Long-term potential: Retest of 0.00007870 – 0.00008836 (key supply zone)
---
📉 Bearish Scenario:
❌ Breakdown below 0.00001090 = major bearish signal
❌ Potential drop toward lower zones:
▪️ 0.00000900
▪️ 0.00000700
▪️ 0.00000550 (next key support zone)
❌ Price structure shifts to lower lows, indicating trend weakness and potential distribution phase
---
🧩 Pattern Insights:
📌 Market showing signs of Sideways Accumulation for over 1.5 years
📌 Could be a Re-Accumulation Phase before a major breakout
📌 Current movement resembles a Wyckoff-style Spring, which often precedes an upward expansion
---
📌 Conclusion:
SHIB is standing at a major inflection point. If buyers continue to defend this support zone, it could mark the beginning of a new bullish cycle. However, if this level breaks, further downside is highly likely.
This is a moment of calm before potential volatility — stay alert and watch volume + price action closely.
#SHIB #SHIBUSDT #CryptoBreakout #SupportZone #AltcoinAnalysis #SHIBAInu #TechnicalAnalysis #AccumulationPhase #WyckoffMethod #CryptoBullish #CryptoBearish
SHIBA/USDT is once again testing a critical support zone that has held strong since early 2022. This area isn’t just a technical level — it represents a long-term accumulation zone where buyers have consistently stepped in.
What happens next could define SHIB's mid to long-term trend. Will we see a major bullish reversal, or is a breakdown and deeper correction looming?
---
📊 Technical Breakdown:
Key Demand Zone (Major Support):
🔸 0.00001090 – 0.00001190 USDT
This zone has been tested multiple times over the past two years. It remains the last major stronghold for bulls. A breakdown here could trigger panic selling.
Important Resistance Levels (Bullish Targets):
🔹 0.00001580 → Initial resistance
🔹 0.00001940 → Previous distribution area
🔹 0.00002400 → Strong psychological level
🔹 0.00003338 → Mid-term bullish target
🔹 0.00007870 – 0.00008836 → High timeframe supply zone and potential long-term profit-taking area
Market Structure:
🔸 Price remains inside a long-term horizontal consolidation range
🔸 No clear breakout yet, but early signs of buyer interest are forming
🔸 Possibility of forming a double bottom or accumulation breakout if bullish momentum strengthens
---
📈 Bullish Scenario:
✅ Price holds above 0.00001190 support
✅ Breakout above 0.00001580 = early trend reversal signal
✅ Bullish confirmation with volume increase
✅ Mid-term targets: 0.00001940 → 0.00002400 → 0.00003338
✅ Long-term potential: Retest of 0.00007870 – 0.00008836 (key supply zone)
---
📉 Bearish Scenario:
❌ Breakdown below 0.00001090 = major bearish signal
❌ Potential drop toward lower zones:
▪️ 0.00000900
▪️ 0.00000700
▪️ 0.00000550 (next key support zone)
❌ Price structure shifts to lower lows, indicating trend weakness and potential distribution phase
---
🧩 Pattern Insights:
📌 Market showing signs of Sideways Accumulation for over 1.5 years
📌 Could be a Re-Accumulation Phase before a major breakout
📌 Current movement resembles a Wyckoff-style Spring, which often precedes an upward expansion
---
📌 Conclusion:
SHIB is standing at a major inflection point. If buyers continue to defend this support zone, it could mark the beginning of a new bullish cycle. However, if this level breaks, further downside is highly likely.
This is a moment of calm before potential volatility — stay alert and watch volume + price action closely.
#SHIB #SHIBUSDT #CryptoBreakout #SupportZone #AltcoinAnalysis #SHIBAInu #TechnicalAnalysis #AccumulationPhase #WyckoffMethod #CryptoBullish #CryptoBearish
✅ Get Free Signals! Join Our Telegram Channel Here: t.me/TheCryptoNuclear
✅ Twitter: twitter.com/crypto_nuclear
✅ Join Bybit : partner.bybit.com/b/nuclearvip
✅ Benefits : Lifetime Trading Fee Discount -50%
✅ Twitter: twitter.com/crypto_nuclear
✅ Join Bybit : partner.bybit.com/b/nuclearvip
✅ Benefits : Lifetime Trading Fee Discount -50%
Penafian
Maklumat dan penerbitan adalah tidak dimaksudkan untuk menjadi, dan tidak membentuk, nasihat untuk kewangan, pelaburan, perdagangan dan jenis-jenis lain atau cadangan yang dibekalkan atau disahkan oleh TradingView. Baca dengan lebih lanjut di Terma Penggunaan.