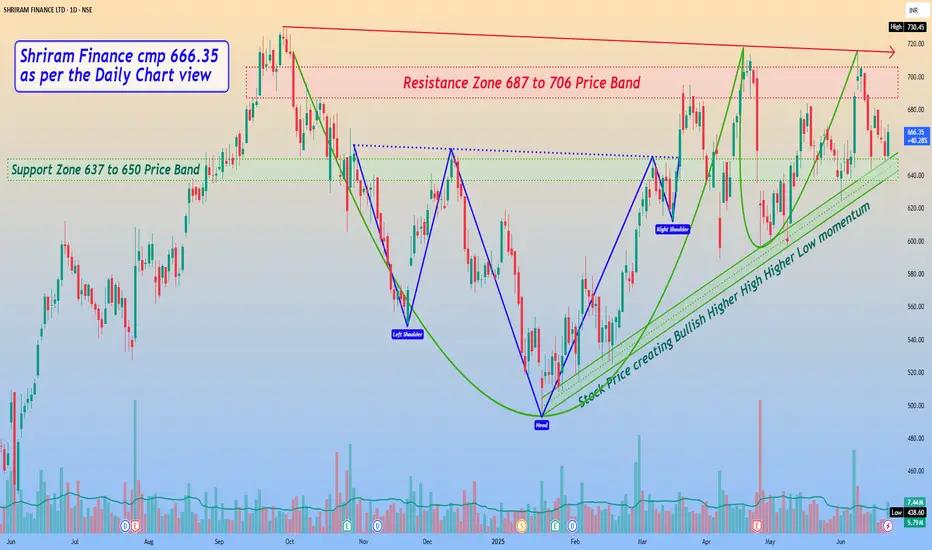
*Shriram Finance cmp 666.35 by Daily Chart view*
- Support Zone 637 to 650 Price Band
- Resistance Zone 687 to 706 Price Band
- *Stock Price creating Bullish Higher High Higher Low momentum*
- Volumes are seen to be in good sync with average traded quantity
- *Price seems testing and retesting the Support Zone over last week*
- Stock made few failed attempts to cross the ATH 730.45 and reversed
- Falling Resistance Trendline and Resistance Zone are good hurdles to crossover
- *Bullish Rounding Bottoms above Resistance Zone neckline and considerate Head & Shoulders is seen*
Penafian
Maklumat dan penerbitan adalah tidak dimaksudkan untuk menjadi, dan tidak membentuk, nasihat untuk kewangan, pelaburan, perdagangan dan jenis-jenis lain atau cadangan yang dibekalkan atau disahkan oleh TradingView. Baca dengan lebih lanjut di Terma Penggunaan.
Penafian
Maklumat dan penerbitan adalah tidak dimaksudkan untuk menjadi, dan tidak membentuk, nasihat untuk kewangan, pelaburan, perdagangan dan jenis-jenis lain atau cadangan yang dibekalkan atau disahkan oleh TradingView. Baca dengan lebih lanjut di Terma Penggunaan.