📈Technical Analysis
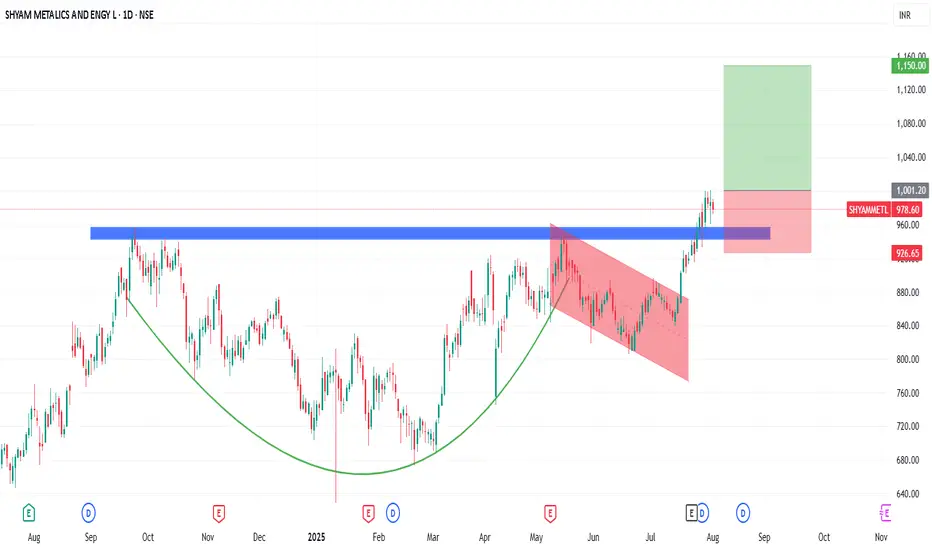
The stock listed in 2021 and was in a downtrend until 2023. From ₹250, it rallied to reach ₹950 in September 2024, forming its all-time high. Since then, the ₹950 zone acted as resistance multiple times, during which a Cup & Handle pattern emerged.
This week, the stock decisively broke that resistance on the back of positive Q1 FY26 results. Trading around ₹978 now, it gained momentum.
Take position only once the stock crosses ₹1,000, targeting:
🎯₹1,050 (Target 1)
🎯₹1,100 (Target 2)
🎯₹1,150 (Target 3)
Keep your stop loss at ₹930. A breach below that invalidates the bullish pattern.
💰Q1 FY26 Financial Highlights (vs Q4 FY25 & Q1 FY25)
🧠Fundamentals & Dividend Insights
Q1 PAT rose 33.6% QoQ to ₹292 Cr, led by improved margins and revenue growth (Revenue ₹4,419 Cr)
EBITDA margin expanded to 13.1% (vs 12.4% QoQ), reflecting cost efficiencies
Management approved fundraising up to ₹4,500 Cr via equity/debt/NCDs, indicating growth capital in pipeline
Interim dividend announced of ₹1.80/share for FY26 — shareholders rewarded amid momentum
Low debt (Debt/Equity ~0.07), strong ROCE (~12%), and high asset turnover reflect financial discipline
✅Summary
Shyam Metalics has displayed a textbook breakout from a notable resistance zone, confirmed by strong Q1 fundamentals and margin expansion. Key inputs:
💵 Revenue up 22% YoY; PAT up 33% QoQ
➕ Fresh strength above ₹950 resistance
🎯 Clear upside targets: ₹1,050 → ₹1,100 → ₹1,150
⚠️ Strict stop-loss level: ₹930
⚠️Disclaimer
This analysis is for informational purposes only and does not constitute investment advice. Please consult a certified financial advisor before making any investment decisions.
The stock listed in 2021 and was in a downtrend until 2023. From ₹250, it rallied to reach ₹950 in September 2024, forming its all-time high. Since then, the ₹950 zone acted as resistance multiple times, during which a Cup & Handle pattern emerged.
This week, the stock decisively broke that resistance on the back of positive Q1 FY26 results. Trading around ₹978 now, it gained momentum.
Take position only once the stock crosses ₹1,000, targeting:
🎯₹1,050 (Target 1)
🎯₹1,100 (Target 2)
🎯₹1,150 (Target 3)
Keep your stop loss at ₹930. A breach below that invalidates the bullish pattern.
💰Q1 FY26 Financial Highlights (vs Q4 FY25 & Q1 FY25)
- Total Income: ₹4,419 Cr (↑ +6.8% QoQ vs ₹4,139 Cr; ↑ +22.4% YoY vs ₹3,612 Cr)
- Total Expenses: ₹3,839 Cr (↑ +5.6% QoQ vs ₹3,624 Cr; ↑ +22.9% YoY vs ₹3,124 Cr)
- Operating Profits (EBITDA): ₹580 Cr (↑ +12.5% QoQ vs ₹515 Cr; ↑ +18.8% YoY vs ₹488 Cr)
- Profit Before Tax: ₹389 Cr (↑ +31% QoQ vs ₹297 Cr; ↑ +4% YoY vs ₹374 Cr)
- Profit After Tax: ₹291 Cr (↑ +32% QoQ vs ₹220 Cr; ↑ +6% YoY vs ₹276 Cr)
- Diluted EPS: ₹10.47 (↑ QoQ vs ₹7.84; ↑ YoY vs ₹9.89)
🧠Fundamentals & Dividend Insights
Q1 PAT rose 33.6% QoQ to ₹292 Cr, led by improved margins and revenue growth (Revenue ₹4,419 Cr)
EBITDA margin expanded to 13.1% (vs 12.4% QoQ), reflecting cost efficiencies
Management approved fundraising up to ₹4,500 Cr via equity/debt/NCDs, indicating growth capital in pipeline
Interim dividend announced of ₹1.80/share for FY26 — shareholders rewarded amid momentum
Low debt (Debt/Equity ~0.07), strong ROCE (~12%), and high asset turnover reflect financial discipline
✅Summary
Shyam Metalics has displayed a textbook breakout from a notable resistance zone, confirmed by strong Q1 fundamentals and margin expansion. Key inputs:
💵 Revenue up 22% YoY; PAT up 33% QoQ
➕ Fresh strength above ₹950 resistance
🎯 Clear upside targets: ₹1,050 → ₹1,100 → ₹1,150
⚠️ Strict stop-loss level: ₹930
⚠️Disclaimer
This analysis is for informational purposes only and does not constitute investment advice. Please consult a certified financial advisor before making any investment decisions.
Penafian
Maklumat dan penerbitan adalah tidak dimaksudkan untuk menjadi, dan tidak membentuk, nasihat untuk kewangan, pelaburan, perdagangan dan jenis-jenis lain atau cadangan yang dibekalkan atau disahkan oleh TradingView. Baca dengan lebih lanjut di Terma Penggunaan.
Penafian
Maklumat dan penerbitan adalah tidak dimaksudkan untuk menjadi, dan tidak membentuk, nasihat untuk kewangan, pelaburan, perdagangan dan jenis-jenis lain atau cadangan yang dibekalkan atau disahkan oleh TradingView. Baca dengan lebih lanjut di Terma Penggunaan.
