📊 SIEMENS Trade Analysis
🔎 Price Action
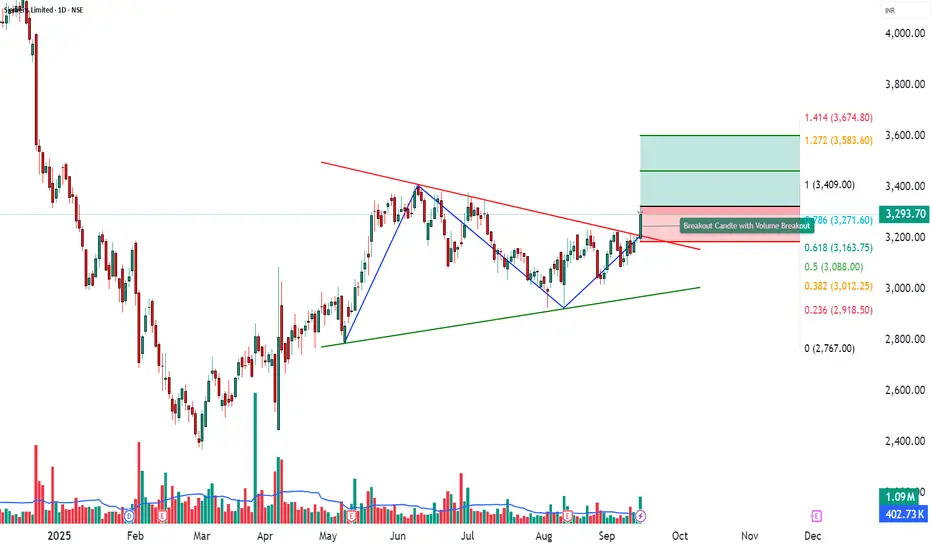
SIEMENS closed at ₹3293.7 with a solid +2.86% gain, backed by a volume of 10.95 lakh, well above its 20-day average of 4.02 lakh (VolX = 3.03x).
This sharp rise in activity highlights strong institutional participation, confirming bullish momentum and improving probability of continuation.
________________________________________
📉 Chart Signals – Symmetrical Triangle
Strong bullish candle backed by heavy volumes.
RSI breakout supporting positive momentum.
Bollinger Band squeeze + breakout → signals volatility expansion.
________________________________________
📍 Key Levels
Resistance: 3349 – 3404 – 3484
Support: 3214 – 3134 – 3079
________________________________________
📈 Investment Outlook
📈 Bullish Case – Why the stock could go up
Strong volume-led breakout (VolX = 3.03x).
Momentum indicators (RSI 62, CCI 193, Stochastic 89) suggest upside strength.
Sustained buying pressure may push stock toward ₹3464 – ₹3602.
📉 Bearish Case – Potential downside risks
Failure to sustain above ₹3325 could trigger profit booking.
Global or market-wide weakness may drag stock back toward supports.
Break below ₹3214 could shift bias to downside.
⚡ Momentum Case – Short-term Trading Edge
Volume surge + RSI breakout confirm short-term momentum.
Bollinger squeeze → strong volatility expansion.
Holding above 3349–3404 may open upside toward ₹3464–₹3602.
📅 Short-term vs Long-term Perspective
Short-term (1–2 weeks): Momentum-driven moves likely; watch resistances at 3349–3484 and supports at 3214–3134.
Long-term (1–3 months): Stock remains in an uptrend; sustained buying with strong volumes could establish higher base levels.
________________________________________
📝 STWP Trade Analysis
Outlook: Momentum: Strong, Trend: Bullish
Entry: 3325 – 3293.75 | Stop-loss: 3186.05
Target-1: 3463.95 | Target-2: 3602.9
Risk/Reward: 1:3.27 | Risk: Low | Volume: High
Demand zone: 3212 - 3181.50 | SL: 3177.50 - Could be a good Pullback zone
Learning Note: SIEMENS shows strong momentum with volume breakout; supports and resistances clearly define near-term trade zones.
________________________________________
⚠️ Disclaimer – Please Read Carefully
The information shared here is meant purely for learning and awareness. It is not a buy or sell recommendation and should not be taken as investment advice. I am not a SEBI-registered investment advisor, and all views expressed are based on personal study, chart patterns, and publicly available market data.
Trading — whether in stocks or options — carries risk. Markets can move unexpectedly, and losses can sometimes exceed the money you have invested. Past performance or past setups do not guarantee future results.
If you are a beginner, treat this as a guide to understand how the market works — practice on paper trades before risking real money. If you are experienced, always assess your own risk, position sizing, and strategy suitability before entering trades.
Consult a SEBI-registered financial advisor before making any real trading decision. By engaging with this content, you acknowledge full responsibility for your trades and investments.
💬 Found this useful?
🔼 Give this post a Boost to help more traders discover clean, structured learning.
✍️ Drop your thoughts, questions, or setups in the comments — let’s grow together!
🔁 Share with fellow traders and beginners to spread awareness.
👉 “If you liked this breakdown, follow for more clean, structured setups with discipline at the core.”
🚀 Stay Calm. Stay Clean. Trade With Patience.
Trade Smart | Learn Zones | Be Self-Reliant 📊
🔎 Price Action
SIEMENS closed at ₹3293.7 with a solid +2.86% gain, backed by a volume of 10.95 lakh, well above its 20-day average of 4.02 lakh (VolX = 3.03x).
This sharp rise in activity highlights strong institutional participation, confirming bullish momentum and improving probability of continuation.
________________________________________
📉 Chart Signals – Symmetrical Triangle
Strong bullish candle backed by heavy volumes.
RSI breakout supporting positive momentum.
Bollinger Band squeeze + breakout → signals volatility expansion.
________________________________________
📍 Key Levels
Resistance: 3349 – 3404 – 3484
Support: 3214 – 3134 – 3079
________________________________________
📈 Investment Outlook
📈 Bullish Case – Why the stock could go up
Strong volume-led breakout (VolX = 3.03x).
Momentum indicators (RSI 62, CCI 193, Stochastic 89) suggest upside strength.
Sustained buying pressure may push stock toward ₹3464 – ₹3602.
📉 Bearish Case – Potential downside risks
Failure to sustain above ₹3325 could trigger profit booking.
Global or market-wide weakness may drag stock back toward supports.
Break below ₹3214 could shift bias to downside.
⚡ Momentum Case – Short-term Trading Edge
Volume surge + RSI breakout confirm short-term momentum.
Bollinger squeeze → strong volatility expansion.
Holding above 3349–3404 may open upside toward ₹3464–₹3602.
📅 Short-term vs Long-term Perspective
Short-term (1–2 weeks): Momentum-driven moves likely; watch resistances at 3349–3484 and supports at 3214–3134.
Long-term (1–3 months): Stock remains in an uptrend; sustained buying with strong volumes could establish higher base levels.
________________________________________
📝 STWP Trade Analysis
Outlook: Momentum: Strong, Trend: Bullish
Entry: 3325 – 3293.75 | Stop-loss: 3186.05
Target-1: 3463.95 | Target-2: 3602.9
Risk/Reward: 1:3.27 | Risk: Low | Volume: High
Demand zone: 3212 - 3181.50 | SL: 3177.50 - Could be a good Pullback zone
Learning Note: SIEMENS shows strong momentum with volume breakout; supports and resistances clearly define near-term trade zones.
________________________________________
⚠️ Disclaimer – Please Read Carefully
The information shared here is meant purely for learning and awareness. It is not a buy or sell recommendation and should not be taken as investment advice. I am not a SEBI-registered investment advisor, and all views expressed are based on personal study, chart patterns, and publicly available market data.
Trading — whether in stocks or options — carries risk. Markets can move unexpectedly, and losses can sometimes exceed the money you have invested. Past performance or past setups do not guarantee future results.
If you are a beginner, treat this as a guide to understand how the market works — practice on paper trades before risking real money. If you are experienced, always assess your own risk, position sizing, and strategy suitability before entering trades.
Consult a SEBI-registered financial advisor before making any real trading decision. By engaging with this content, you acknowledge full responsibility for your trades and investments.
💬 Found this useful?
🔼 Give this post a Boost to help more traders discover clean, structured learning.
✍️ Drop your thoughts, questions, or setups in the comments — let’s grow together!
🔁 Share with fellow traders and beginners to spread awareness.
👉 “If you liked this breakdown, follow for more clean, structured setups with discipline at the core.”
🚀 Stay Calm. Stay Clean. Trade With Patience.
Trade Smart | Learn Zones | Be Self-Reliant 📊
STWP | Mentor & Demand-Supply Specialist | Empowering traders through structured learning |
simpletradewithpatience.com
Community: chat.whatsapp.com/BEYz0tkqP0fJPBCWf59uel
wa.me/message/6IOPHGOXMGZ4N1
Educational Only
simpletradewithpatience.com
Community: chat.whatsapp.com/BEYz0tkqP0fJPBCWf59uel
wa.me/message/6IOPHGOXMGZ4N1
Educational Only
Penerbitan berkaitan
Penafian
Maklumat dan penerbitan adalah tidak bertujuan, dan tidak membentuk, nasihat atau cadangan kewangan, pelaburan, dagangan atau jenis lain yang diberikan atau disahkan oleh TradingView. Baca lebih dalam Terma Penggunaan.