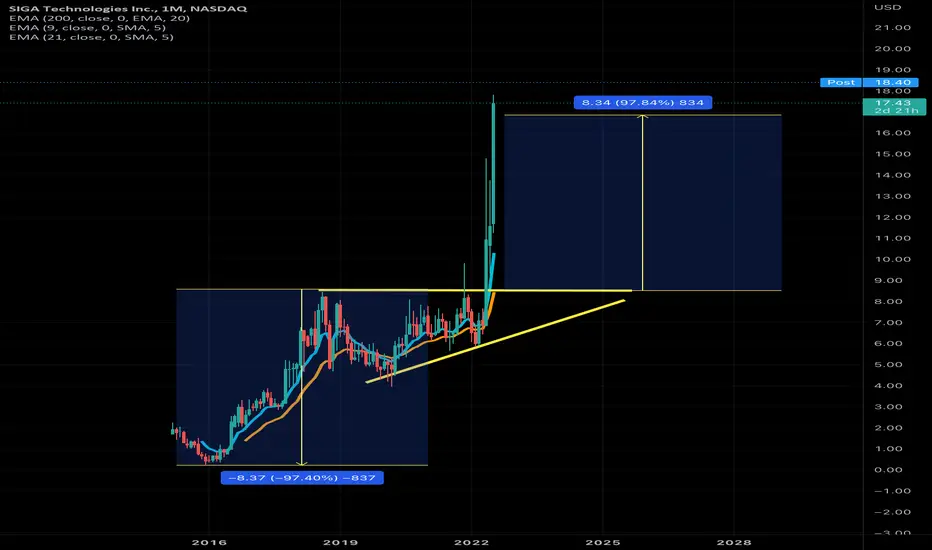
This is Siga. If you view on a different chart this has formed a giant inverse head and shoulders on the monthly candle from 2011
From the bottom after re listing on the major exchanges ( it went otc pink back in the day)
Measuring from the bottom to the top of a multi year ascending wedge Then measuring again from the resistance of the wedge to the price now.
I’m short. -5000 shares cost average 17.50
It’s like a miniature UPST Which I rode from the mid 200s short all the way to 400. Averaging up slowly. All the way back to reality
Penafian
Maklumat dan penerbitan adalah tidak dimaksudkan untuk menjadi, dan tidak membentuk, nasihat untuk kewangan, pelaburan, perdagangan dan jenis-jenis lain atau cadangan yang dibekalkan atau disahkan oleh TradingView. Baca dengan lebih lanjut di Terma Penggunaan.
Penafian
Maklumat dan penerbitan adalah tidak dimaksudkan untuk menjadi, dan tidak membentuk, nasihat untuk kewangan, pelaburan, perdagangan dan jenis-jenis lain atau cadangan yang dibekalkan atau disahkan oleh TradingView. Baca dengan lebih lanjut di Terma Penggunaan.
