Silver Forming Major Top Near Supply Downside Retracement Likely
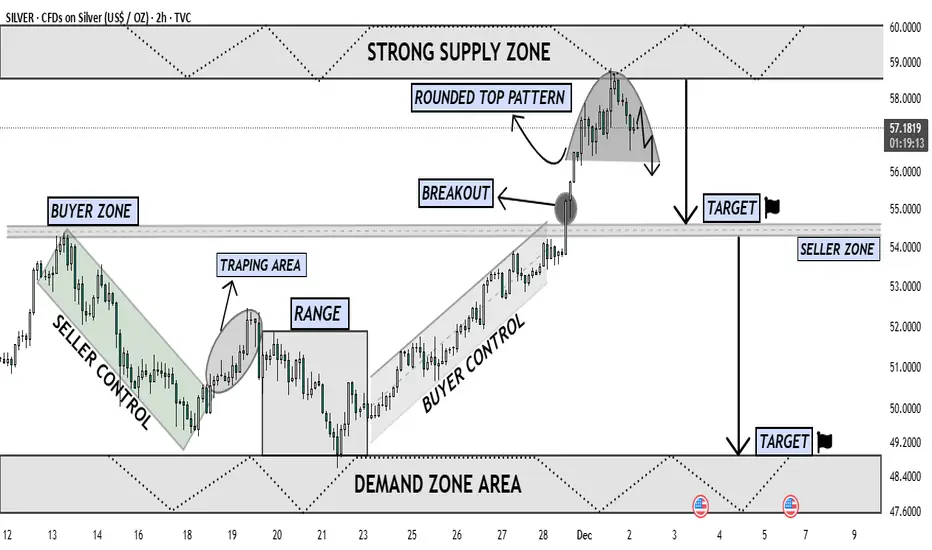
The chart shows Silver reaching a major Strong Supply Zone near the 58–60 level, where price has reacted multiple times in the past. After a strong impulsive rally driven by Buyer Control, the market broke above the previous Buyer Zone, confirming bullish strength. However, once price entered the upper supply region, momentum started to fade, forming a clear Rounded Top Pattern — a classic distribution structure indicating exhaustion of buyers.
Following the breakout retest, buyers failed to continue upward, and sellers stepped in aggressively from the supply zone. The chart now shows a shift from buyer dominance to seller pressure, with price beginning to curve downward inside the rounded top. This shape reflects decreasing highs, weakening demand, and early reversal signals.
The projected move suggests that once the neckline of the rounded top breaks with strong bearish candle confirmation, price is likely to fall toward the first Target Zone around 54, which aligns with the Seller Zone and previous breakout structure. If bearish continuation remains strong, the next logical target lies in the Demand Zone Area between 48–49, where liquidity is expected to support a potential reversal or consolidation.
Overall, this chart indicates a high-probability corrective phase, with sellers preparing to reclaim control as the market rejects the supply zone and transitions into a deeper pullback phase. Buyers must show strong defense at the mid-support; otherwise, Silver could decline further toward the lower demand region.
Dagangan aktif
⚜️Free VIP Signals
t.me/Forexfrontierfx
⚜️Daily Market Mapping
t.me/Forexfrontierfx
⚜️Join My Refferel Broker
one.exnessonelink.com/a/uvd1etcgg1
Refferal Code -
uvd1etcgg1
t.me/Forexfrontierfx
⚜️Daily Market Mapping
t.me/Forexfrontierfx
⚜️Join My Refferel Broker
one.exnessonelink.com/a/uvd1etcgg1
Refferal Code -
uvd1etcgg1
Penerbitan berkaitan
Penafian
Maklumat dan penerbitan adalah tidak bertujuan, dan tidak membentuk, nasihat atau cadangan kewangan, pelaburan, dagangan atau jenis lain yang diberikan atau disahkan oleh TradingView. Baca lebih dalam Terma Penggunaan.