SMLISUZU: Explosive Cup and Handle Breakout, Chart of the Month
From Years of Consolidation to Explosive Breakout: Why  SMLISUZU Cup & Handle Pattern Could Deliver Multi-Bagger Returns. Let's Deep Dive into "Chart of the Month"
Price Action Analysis:
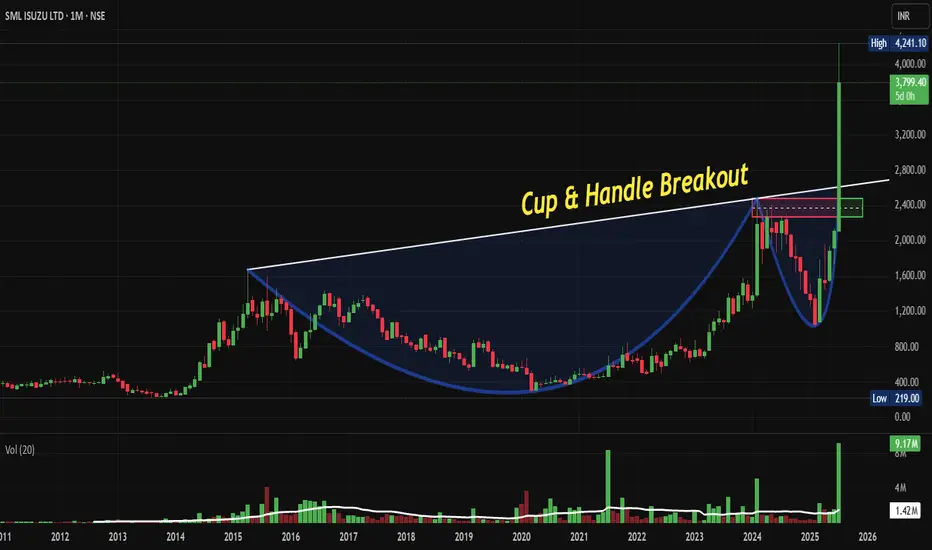
- Current trading price is approximately ₹3,799.40
- The stock has demonstrated a textbook Cup & Handle formation spanning over a decade (2015-2025)
- Post-breakout momentum shows strong bullish continuation with healthy volume expansion
- Recent breakout above the ₹2,400 breakout level indicates institutional accumulation
Volume Spread Analysis:
- Volume spike during the 2024-2025 breakout phase confirms genuine institutional interest
- Average daily volume has increased significantly from historical levels
- Volume pattern shows healthy distribution during consolidation phases and accumulation during breakouts
- Recent volume bars indicate sustained buying interest at higher levels
Key Technical Levels:
Base Formation:
- Primary base formed between 2020-2023 at ₹400-800 levels
- Secondary base consolidation occurred in 2023-2024 around ₹1,200-1,600 range
- The decade-long cup formation created a strong foundation for the current uptrend
Support Levels:
- Immediate support: ₹3,200-3,400 (recent consolidation zone)
- Strong support: ₹2,400-2,600 (cup breakout level)
- Critical support: ₹1,800-2,000 (previous resistance turned support)
- Long-term support: ₹1,200-1,400 (base formation)
Resistance Levels:
- Immediate resistance: ₹4,200-4,400 (psychological round number)
- Next resistance: ₹4,800-5,000 (projected target based on cup depth)
- Long-term target: ₹6,000+ (measured move from cup formation)
Technical Pattern:
Cup & Handle Pattern
- Formation period: 2015-2025 (10-year formation)
- Cup depth: Approximately ₹1,800 (from ₹2,400 high to ₹600 low)
- Handle formation: 2024-2025 consolidation
- Breakout confirmation: Volume expansion above ₹2,400
Moving Average Alignment:
- Price trading above all major moving averages
- Strong uptrend with moving averages in bullish sequence
- No signs of trend reversal in the immediate term
Trade Setup:
Entry Levels:
- Aggressive entry: ₹3,600-3,700 (current market price on minor dips)
- Conservative entry: ₹3,200-3,400 (on pullback to support)
- Accumulation zone: ₹2,800-3,200 (for long-term positions)
Exit Levels:
- Target 1: ₹4,500-4,700 (25-30% upside)
- Target 2: ₹5,500-5,800 (50-60% upside)
- Target 3: ₹6,500+ (multi-bagger potential)
Stop-Loss Strategy:
- For aggressive entries: ₹3,100 (8-10% risk)
- For conservative entries: ₹2,800 (12-15% risk)
- Trailing stop: Use a 20% trailing stop once the position moves 30% in favour
Position Sizing & Risk Management:
Position Sizing Guidelines
- Conservative investors: 2-3% of portfolio
- Moderate risk investors: 3-5% of portfolio
- Aggressive investors: 5-8% of portfolio (maximum recommended)
Risk Management Framework
- Never risk more than 2% of the total portfolio on a single trade
- Use position sizing formula: (Portfolio Risk ÷ Trade Risk) × 100
- Implement pyramid buying on pullbacks to support levels
- Book partial profits at each target level (33% at each target)
Portfolio Allocation Strategy:
- Core holding: 60% of position for long-term (2-3 years)
- Trading position: 40% for swing trades and profit booking
- Rebalance quarterly based on technical developments
Sectoral & Fundamental Backdrop:
Commercial Vehicle Sector Overview:
- The Commercial Vehicles market in India is projected to grow by 2.13% (2025-2030), resulting in a market volume of 1,165.00k vehicles in 2030
- India's commercial vehicle industry is gearing up for a modest recovery, with ICRA forecasting a 3-5 per cent year-on-year growth in wholesale volumes for FY26
- The India Commercial Vehicles Market size is estimated at 51.09 billion USD in 2025, and is expected to reach 62.95 billion USD by 2029, growing at a CAGR of 5.36%
Industry Dynamics:
- Infrastructure development is driving demand for commercial vehicles
- The government's focus on road construction and the logistics sector
- The e-commerce boom is increasing last-mile delivery vehicle demand
- Replacement demand cycle supporting steady growth
Company Fundamentals:
- Net profit of SML ISUZU rose 44.34% to Rs 67 crore in the quarter ended June 2025 as against Rs 46 crore during the previous quarter ended June 2024. Sales rose 13.39% to Rs 846 crore in the quarter ended June 2025
- Market Cap: 5,498 Crore (up 84.8% in 1 year), Revenue: 2,498 Cr, Profit: 142 Cr, Promoter Holding: 43.96%
Business Model Strengths:
-SMLISUZU Limited manufactures and sells commercial vehicles and related parts in India and internationally. Its products include trucks and buses
- Strong partnership with Isuzu Motors for technology and product development
- Focus on fuel-efficient and reliable commercial vehicles
- Growing aftermarket services contributing to recurring revenue
Financial Health Indicators:
- Consistent revenue growth over recent quarters
- Improving profit margins, indicating operational efficiency
- Stable promoter holding, suggesting management confidence
- Strong balance sheet supporting growth investments
Risk Assessment:
Technical Risks:
- Failure to hold ₹3,200 support could trigger correction to ₹2,800
- High volatility expected due to recent sharp price appreciation
- Potential profit booking pressure at psychological levels
Fundamental Risks:
- Cyclical nature of the commercial vehicle industry
- Dependency on economic growth and infrastructure spending
- Competition from established players like Tata Motors
- Raw material cost fluctuations impacting margins
Market Risks:
- Overall market correction could impact individual stock performance
- Interest rate changes affecting vehicle financing demand
- Regulatory changes in emission norms requiring investment
My Take:
SMLISUZU presents a compelling technical setup with the successful breakout from a decade-long Cup & Handle pattern. The combination of strong fundamentals, improving sector dynamics, and bullish technical indicators suggests potential for significant upside. However, investors should implement proper risk management given the stock's recent appreciation and inherent sector volatility.
The stock appears well-positioned to benefit from India's infrastructure growth story and the recovery of the commercial vehicle sector. Technical indicators support a bullish outlook with multiple price targets achievable over the next 12-18 months.
Keep in the Watchlist and DOYR.
NO RECO. For Buy/Sell.
📌Thank you for exploring my idea! I hope you found it valuable.
🙏FOLLOW for more
👍BOOST if you found it useful.
✍️COMMENT below with your views.
Meanwhile, check out my other stock ideas on the right side until this trade is activated. I would love your feedback.
Disclaimer: "I am not a SEBI REGISTERED RESEARCH ANALYST AND INVESTMENT ADVISER."
This analysis is intended solely for informational and educational purposes and should not be interpreted as financial advice. It is advisable to consult a qualified financial advisor or conduct thorough research before making investment decisions.
Price Action Analysis:
- Current trading price is approximately ₹3,799.40
- The stock has demonstrated a textbook Cup & Handle formation spanning over a decade (2015-2025)
- Post-breakout momentum shows strong bullish continuation with healthy volume expansion
- Recent breakout above the ₹2,400 breakout level indicates institutional accumulation
Volume Spread Analysis:
- Volume spike during the 2024-2025 breakout phase confirms genuine institutional interest
- Average daily volume has increased significantly from historical levels
- Volume pattern shows healthy distribution during consolidation phases and accumulation during breakouts
- Recent volume bars indicate sustained buying interest at higher levels
Key Technical Levels:
Base Formation:
- Primary base formed between 2020-2023 at ₹400-800 levels
- Secondary base consolidation occurred in 2023-2024 around ₹1,200-1,600 range
- The decade-long cup formation created a strong foundation for the current uptrend
Support Levels:
- Immediate support: ₹3,200-3,400 (recent consolidation zone)
- Strong support: ₹2,400-2,600 (cup breakout level)
- Critical support: ₹1,800-2,000 (previous resistance turned support)
- Long-term support: ₹1,200-1,400 (base formation)
Resistance Levels:
- Immediate resistance: ₹4,200-4,400 (psychological round number)
- Next resistance: ₹4,800-5,000 (projected target based on cup depth)
- Long-term target: ₹6,000+ (measured move from cup formation)
Technical Pattern:
Cup & Handle Pattern
- Formation period: 2015-2025 (10-year formation)
- Cup depth: Approximately ₹1,800 (from ₹2,400 high to ₹600 low)
- Handle formation: 2024-2025 consolidation
- Breakout confirmation: Volume expansion above ₹2,400
Moving Average Alignment:
- Price trading above all major moving averages
- Strong uptrend with moving averages in bullish sequence
- No signs of trend reversal in the immediate term
Trade Setup:
Entry Levels:
- Aggressive entry: ₹3,600-3,700 (current market price on minor dips)
- Conservative entry: ₹3,200-3,400 (on pullback to support)
- Accumulation zone: ₹2,800-3,200 (for long-term positions)
Exit Levels:
- Target 1: ₹4,500-4,700 (25-30% upside)
- Target 2: ₹5,500-5,800 (50-60% upside)
- Target 3: ₹6,500+ (multi-bagger potential)
Stop-Loss Strategy:
- For aggressive entries: ₹3,100 (8-10% risk)
- For conservative entries: ₹2,800 (12-15% risk)
- Trailing stop: Use a 20% trailing stop once the position moves 30% in favour
Position Sizing & Risk Management:
Position Sizing Guidelines
- Conservative investors: 2-3% of portfolio
- Moderate risk investors: 3-5% of portfolio
- Aggressive investors: 5-8% of portfolio (maximum recommended)
Risk Management Framework
- Never risk more than 2% of the total portfolio on a single trade
- Use position sizing formula: (Portfolio Risk ÷ Trade Risk) × 100
- Implement pyramid buying on pullbacks to support levels
- Book partial profits at each target level (33% at each target)
Portfolio Allocation Strategy:
- Core holding: 60% of position for long-term (2-3 years)
- Trading position: 40% for swing trades and profit booking
- Rebalance quarterly based on technical developments
Sectoral & Fundamental Backdrop:
Commercial Vehicle Sector Overview:
- The Commercial Vehicles market in India is projected to grow by 2.13% (2025-2030), resulting in a market volume of 1,165.00k vehicles in 2030
- India's commercial vehicle industry is gearing up for a modest recovery, with ICRA forecasting a 3-5 per cent year-on-year growth in wholesale volumes for FY26
- The India Commercial Vehicles Market size is estimated at 51.09 billion USD in 2025, and is expected to reach 62.95 billion USD by 2029, growing at a CAGR of 5.36%
Industry Dynamics:
- Infrastructure development is driving demand for commercial vehicles
- The government's focus on road construction and the logistics sector
- The e-commerce boom is increasing last-mile delivery vehicle demand
- Replacement demand cycle supporting steady growth
Company Fundamentals:
- Net profit of SML ISUZU rose 44.34% to Rs 67 crore in the quarter ended June 2025 as against Rs 46 crore during the previous quarter ended June 2024. Sales rose 13.39% to Rs 846 crore in the quarter ended June 2025
- Market Cap: 5,498 Crore (up 84.8% in 1 year), Revenue: 2,498 Cr, Profit: 142 Cr, Promoter Holding: 43.96%
Business Model Strengths:
-
- Strong partnership with Isuzu Motors for technology and product development
- Focus on fuel-efficient and reliable commercial vehicles
- Growing aftermarket services contributing to recurring revenue
Financial Health Indicators:
- Consistent revenue growth over recent quarters
- Improving profit margins, indicating operational efficiency
- Stable promoter holding, suggesting management confidence
- Strong balance sheet supporting growth investments
Risk Assessment:
Technical Risks:
- Failure to hold ₹3,200 support could trigger correction to ₹2,800
- High volatility expected due to recent sharp price appreciation
- Potential profit booking pressure at psychological levels
Fundamental Risks:
- Cyclical nature of the commercial vehicle industry
- Dependency on economic growth and infrastructure spending
- Competition from established players like Tata Motors
- Raw material cost fluctuations impacting margins
Market Risks:
- Overall market correction could impact individual stock performance
- Interest rate changes affecting vehicle financing demand
- Regulatory changes in emission norms requiring investment
My Take:
The stock appears well-positioned to benefit from India's infrastructure growth story and the recovery of the commercial vehicle sector. Technical indicators support a bullish outlook with multiple price targets achievable over the next 12-18 months.
Keep in the Watchlist and DOYR.
NO RECO. For Buy/Sell.
📌Thank you for exploring my idea! I hope you found it valuable.
🙏FOLLOW for more
👍BOOST if you found it useful.
✍️COMMENT below with your views.
Meanwhile, check out my other stock ideas on the right side until this trade is activated. I would love your feedback.
Disclaimer: "I am not a SEBI REGISTERED RESEARCH ANALYST AND INVESTMENT ADVISER."
This analysis is intended solely for informational and educational purposes and should not be interpreted as financial advice. It is advisable to consult a qualified financial advisor or conduct thorough research before making investment decisions.
Dagangan aktif
- Target 1: ₹4,500-4,700 (25-30% upside) DonePenerbitan berkaitan
Penafian
Maklumat dan penerbitan adalah tidak bertujuan, dan tidak membentuk, nasihat atau cadangan kewangan, pelaburan, dagangan atau jenis lain yang diberikan atau disahkan oleh TradingView. Baca lebih dalam Terma Penggunaan.
Penerbitan berkaitan
Penafian
Maklumat dan penerbitan adalah tidak bertujuan, dan tidak membentuk, nasihat atau cadangan kewangan, pelaburan, dagangan atau jenis lain yang diberikan atau disahkan oleh TradingView. Baca lebih dalam Terma Penggunaan.