SOL/USD Technical Review
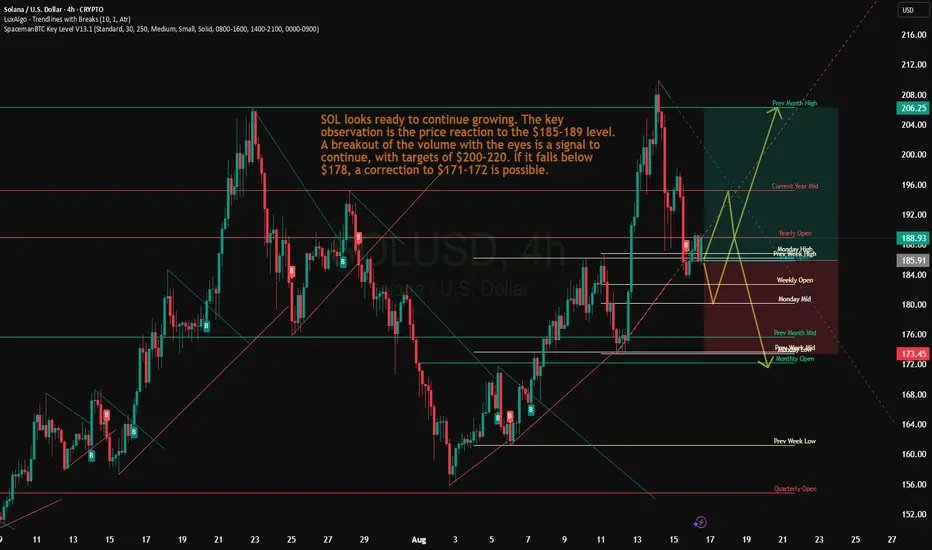
Support around $178 (20-day EMA) is holding the price, indicating high buying interest.
The key resistance level is $185–$189. A breakout of this range will open the way to targets of $200–206, possibly even $220 if the momentum continues.
Pattern formation: an upward reversal from the $160 zone (lower Bollinger band + Fibonacci) is recorded, which completes the ABC correction and launches a new wave impulse. Upside potential is towards $180.
Trend and on-chain indicators: a decrease in the balance on exchanges, an increase in TVL and growing institutional interest (ETF) create a solid base for moving higher.
Dagangan ditutup: hentian tercapai
Take Profit 1 reachedNota
TP 2Penerbitan berkaitan
Penafian
Maklumat dan penerbitan adalah tidak dimaksudkan untuk menjadi, dan tidak membentuk, nasihat untuk kewangan, pelaburan, perdagangan dan jenis-jenis lain atau cadangan yang dibekalkan atau disahkan oleh TradingView. Baca dengan lebih lanjut di Terma Penggunaan.
Penerbitan berkaitan
Penafian
Maklumat dan penerbitan adalah tidak dimaksudkan untuk menjadi, dan tidak membentuk, nasihat untuk kewangan, pelaburan, perdagangan dan jenis-jenis lain atau cadangan yang dibekalkan atau disahkan oleh TradingView. Baca dengan lebih lanjut di Terma Penggunaan.