Current Technical Landscape
Key Support Zone - 20-day EMA (~$178.25): SOL is trading around $180, and a break below this level could lead to a decline towards $171.78. On the other hand, a bounce back would open the way to the $186.40 and $190.47 areas.
Short-Term Weakness and Cooling Activity: Despite growing by over 40% in July, there is now a decline in on-chain activity:
Active Addresses Down 16%
DeFi TVL Down 8%
This could increase bearish pressure in the short term.
Resistance on the 4-hour chart: According to Seeking Alpha, SOL faces strong resistance at the 20-EMA (~$164.78) and below the 50/100-EMA zones (between $170.73 and $174.14), while the downtrend remains dominant.
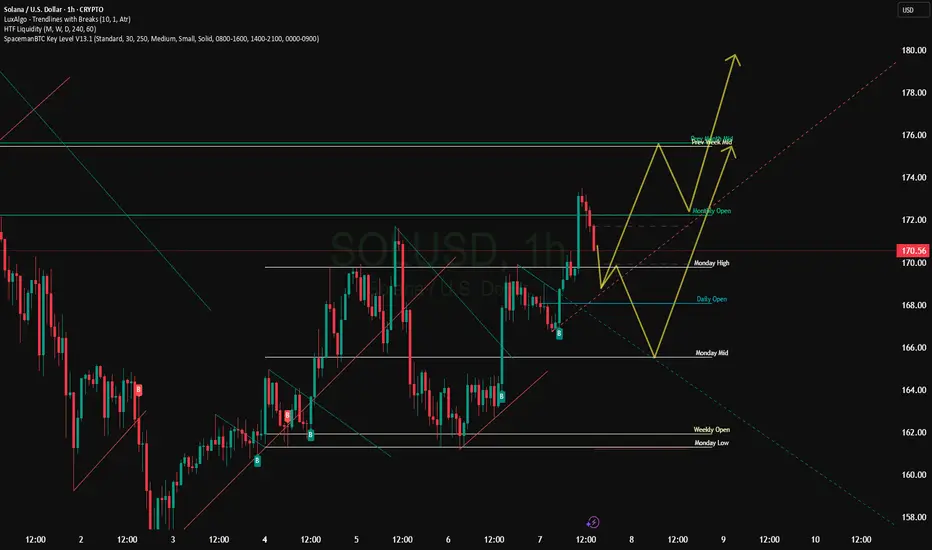
Structure overview and signals
TipRanks indicators:
General recommendation: Sell
RSI (~43.05): Neutral
MACD: Buy
Stochastic RSI, Williams %R, CCI: Buy
MA 20/50/200: mostly Sell, except MA100 (was Buy)
TipRanks
Support and resistance by Pivot (TipRanks):
Pivot: $166.49
Support: $163.12, $158.24, $154.87
Resistance: $171.38, $174.74, $179.6
Key Support Zone - 20-day EMA (~$178.25): SOL is trading around $180, and a break below this level could lead to a decline towards $171.78. On the other hand, a bounce back would open the way to the $186.40 and $190.47 areas.
Short-Term Weakness and Cooling Activity: Despite growing by over 40% in July, there is now a decline in on-chain activity:
Active Addresses Down 16%
DeFi TVL Down 8%
This could increase bearish pressure in the short term.
Resistance on the 4-hour chart: According to Seeking Alpha, SOL faces strong resistance at the 20-EMA (~$164.78) and below the 50/100-EMA zones (between $170.73 and $174.14), while the downtrend remains dominant.
Structure overview and signals
TipRanks indicators:
General recommendation: Sell
RSI (~43.05): Neutral
MACD: Buy
Stochastic RSI, Williams %R, CCI: Buy
MA 20/50/200: mostly Sell, except MA100 (was Buy)
TipRanks
Support and resistance by Pivot (TipRanks):
Pivot: $166.49
Support: $163.12, $158.24, $154.87
Resistance: $171.38, $174.74, $179.6
Penerbitan berkaitan
Penafian
The information and publications are not meant to be, and do not constitute, financial, investment, trading, or other types of advice or recommendations supplied or endorsed by TradingView. Read more in the Terms of Use.
Penerbitan berkaitan
Penafian
The information and publications are not meant to be, and do not constitute, financial, investment, trading, or other types of advice or recommendations supplied or endorsed by TradingView. Read more in the Terms of Use.