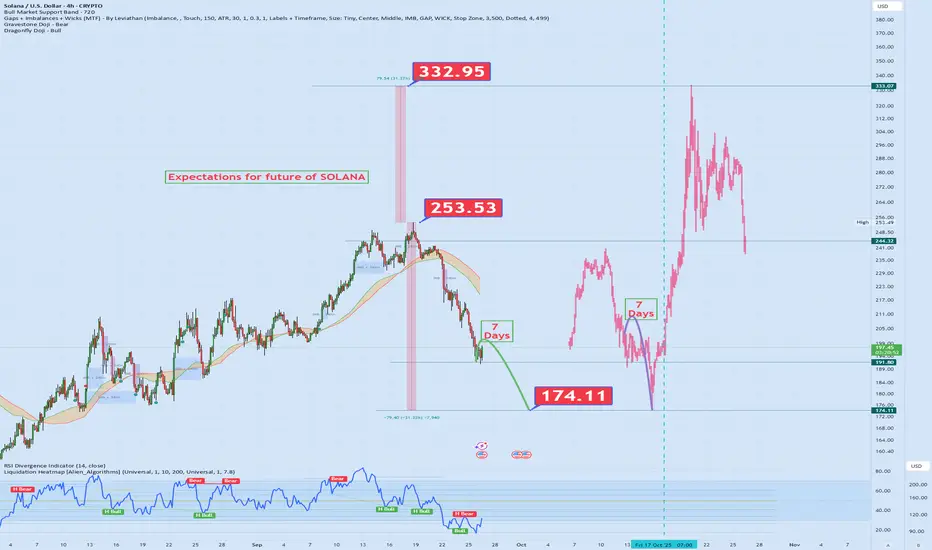
I've combined past price action with future possibilities on the SOL chart. Here are the key highlights:
🚀 Peak Level: 332.95 📉 Correction Zone: 253.53 🛑 Support Area: 174.11
📍 Supported by RSI and moving averages, the red line represents my personal expectation. It points to a potential recovery and a new bullish trend. 💥
🔁 I’ve mapped out scenario-based planning using historical price behavior—now my eyes are on that red trajectory! 💡 Technical analysis + intuition = strategic positioning!
📌 What do you think? Will this scenario play out? Drop your thoughts below! 👇
Penafian
Maklumat dan penerbitan adalah tidak dimaksudkan untuk menjadi, dan tidak membentuk, nasihat untuk kewangan, pelaburan, perdagangan dan jenis-jenis lain atau cadangan yang dibekalkan atau disahkan oleh TradingView. Baca dengan lebih lanjut di Terma Penggunaan.
Penafian
Maklumat dan penerbitan adalah tidak dimaksudkan untuk menjadi, dan tidak membentuk, nasihat untuk kewangan, pelaburan, perdagangan dan jenis-jenis lain atau cadangan yang dibekalkan atau disahkan oleh TradingView. Baca dengan lebih lanjut di Terma Penggunaan.