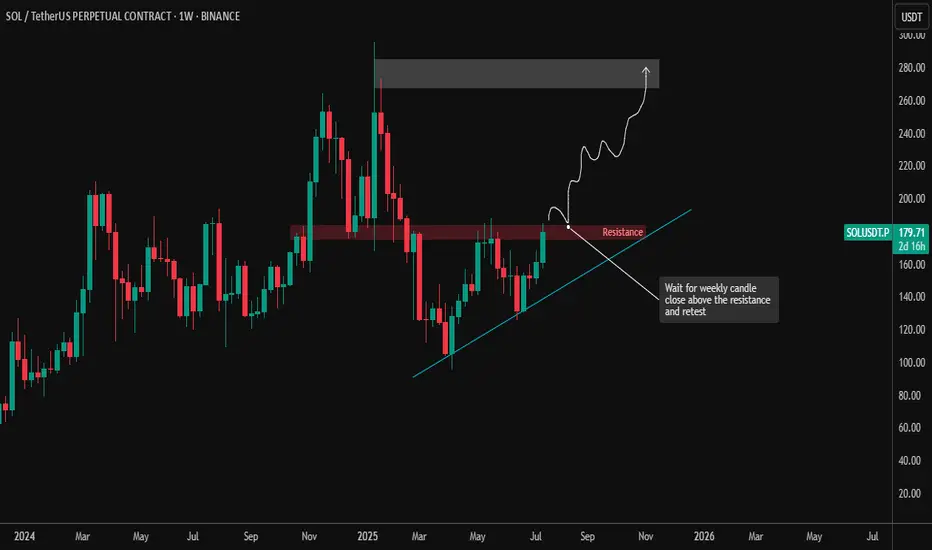
Solana is at a critical breakout point as price pushes against a long-standing horizontal resistance zone between $175–$180. This zone has been tested multiple times since late 2024, making it a significant level to watch.
🔹 Current Price: ~$179.66
🔹 Resistance Zone: $175–$180
🔹 Next Major Supply Zone: $260–$290
🔹 Trendline Support: Still intact and respected since the Q2 lows
📌 Key Setup:
SOL is attempting a breakout above the horizontal resistance.
Price structure shows a series of higher lows, indicating growing bullish momentum.
A weekly candle close above $180 followed by a successful retest would confirm the breakout and could open up upside toward the $260–$290 zone.
📈 Trade Plan:
Breakout Entry: After a confirmed weekly close + bullish retest of $175–$180
Invalidation: Break below trendline and failure to hold above $160
Target: $260–$290 zone, where previous supply stepped in
🧠 Patience is key: Wait for confirmation and don’t chase breakout candles. This level has historically acted as a trap — confirmation is critical for safer entries.
#Solana #SOLUSDT #CryptoTrading #TechnicalAnalysis #Altcoins #Binance
Penafian
Maklumat dan penerbitan adalah tidak bertujuan, dan tidak membentuk, nasihat atau cadangan kewangan, pelaburan, dagangan atau jenis lain yang diberikan atau disahkan oleh TradingView. Baca lebih dalam Terma Penggunaan.
Penafian
Maklumat dan penerbitan adalah tidak bertujuan, dan tidak membentuk, nasihat atau cadangan kewangan, pelaburan, dagangan atau jenis lain yang diberikan atau disahkan oleh TradingView. Baca lebih dalam Terma Penggunaan.