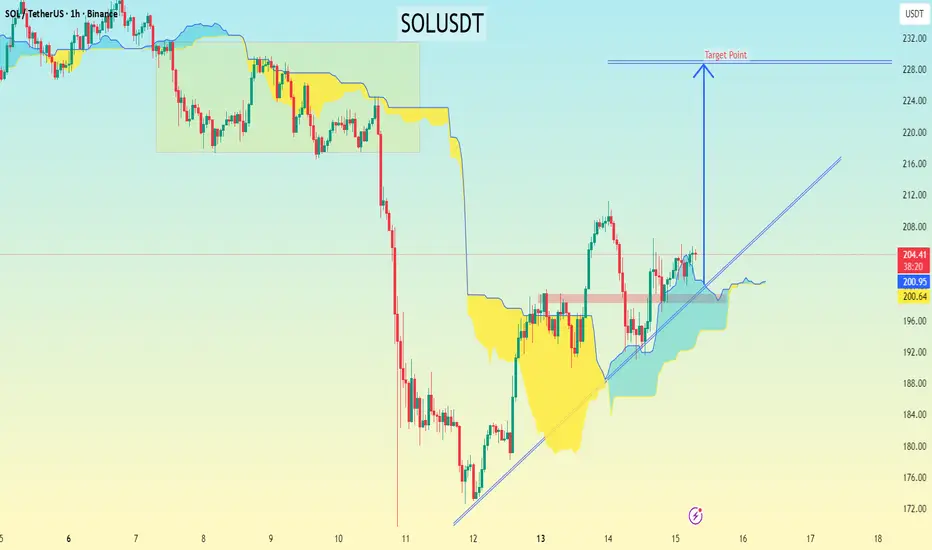
SOLUSDT chart (1-hour timeframe), here’s a detailed breakdown of the setup and the potential target based on the price structure and Ichimoku setup:
---
🔍 Chart Observations
Current price: around $205
The price has broken above the Ichimoku Cloud, confirming a short-term bullish bias.
A rising trendline from the $180 area is providing strong support.
The “Target Point” label I have drawn sits roughly around $230–232.
The cloud (Kumo) is bullish and widening, suggesting potential continuation upward.
---
🎯 Target Levels
Based on structure and Ichimoku confirmation:
1. First target (short-term): $212 — local resistance area / psychological level
2. Main target: $228–232 — aligns perfectly with my chart’s “Target Point” label and previous swing-high zone
3. Extended target (if momentum continues): $240 — strong resistance from the last consolidation before the drop
---
🛑 Stop-Loss Suggestion
Below the trendline or the Kumo support: around $198–200
(A clean break below this would invalidate the bullish setup.)
---
⚖ Trade Plan Summary
Type Entry Stop Target 1 Target 2 Risk:Reward
Long $204–206 $198 $212 $228–232 ~1:2.5–1:3
---
📈 Summary:
Trend = Bullish
Entry = On retest of $202–205 area
Target = $228–232
Stop = Below $198
---
🔍 Chart Observations
Current price: around $205
The price has broken above the Ichimoku Cloud, confirming a short-term bullish bias.
A rising trendline from the $180 area is providing strong support.
The “Target Point” label I have drawn sits roughly around $230–232.
The cloud (Kumo) is bullish and widening, suggesting potential continuation upward.
---
🎯 Target Levels
Based on structure and Ichimoku confirmation:
1. First target (short-term): $212 — local resistance area / psychological level
2. Main target: $228–232 — aligns perfectly with my chart’s “Target Point” label and previous swing-high zone
3. Extended target (if momentum continues): $240 — strong resistance from the last consolidation before the drop
---
🛑 Stop-Loss Suggestion
Below the trendline or the Kumo support: around $198–200
(A clean break below this would invalidate the bullish setup.)
---
⚖ Trade Plan Summary
Type Entry Stop Target 1 Target 2 Risk:Reward
Long $204–206 $198 $212 $228–232 ~1:2.5–1:3
---
📈 Summary:
Trend = Bullish
Entry = On retest of $202–205 area
Target = $228–232
Stop = Below $198
Dagangan aktif
trade active📲 Join telegram channel free .
t.me/addlist/dg3uSwzkMSplNjFk
Forex, Gold & Crypto Signals with detailed analysis & get consistent results.
t.me/+PNWQFM8CwnswYTc0
Gold Signal's with proper TP & SL for high profit opportunities.
t.me/addlist/dg3uSwzkMSplNjFk
Forex, Gold & Crypto Signals with detailed analysis & get consistent results.
t.me/+PNWQFM8CwnswYTc0
Gold Signal's with proper TP & SL for high profit opportunities.
Penerbitan berkaitan
Penafian
Maklumat dan penerbitan adalah tidak bertujuan, dan tidak membentuk, nasihat atau cadangan kewangan, pelaburan, dagangan atau jenis lain yang diberikan atau disahkan oleh TradingView. Baca lebih dalam Terma Penggunaan.
📲 Join telegram channel free .
t.me/addlist/dg3uSwzkMSplNjFk
Forex, Gold & Crypto Signals with detailed analysis & get consistent results.
t.me/+PNWQFM8CwnswYTc0
Gold Signal's with proper TP & SL for high profit opportunities.
t.me/addlist/dg3uSwzkMSplNjFk
Forex, Gold & Crypto Signals with detailed analysis & get consistent results.
t.me/+PNWQFM8CwnswYTc0
Gold Signal's with proper TP & SL for high profit opportunities.
Penerbitan berkaitan
Penafian
Maklumat dan penerbitan adalah tidak bertujuan, dan tidak membentuk, nasihat atau cadangan kewangan, pelaburan, dagangan atau jenis lain yang diberikan atau disahkan oleh TradingView. Baca lebih dalam Terma Penggunaan.