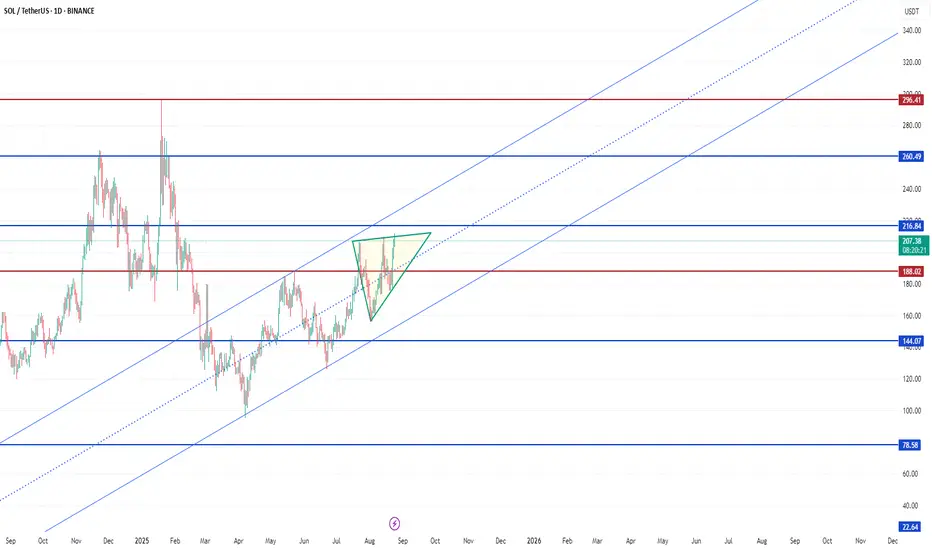
The bar chart is in a mid-upward trend, having started in April 2025 and continued up to the present. Now, the chart is trapped in a triangle for a month. The future trend of the chart depends on the following break. If it can break above the triangle, and respectively exceed the resistance level, at $217, it would increase by $216 in the mid term.
On the other hand, the opposite scenario is a break below. In other words, the price might reduce to $144 if it breaks the support level, at $188, it is a crucial level because of the juncture of the bottom of the triangle, and $188 support level.
To sum up, there are two ways, an increase or a decrease, for SOLANA, and it generally depends on the first break will occur up or down.
Penafian
Maklumat dan penerbitan adalah tidak dimaksudkan untuk menjadi, dan tidak membentuk, nasihat untuk kewangan, pelaburan, perdagangan dan jenis-jenis lain atau cadangan yang dibekalkan atau disahkan oleh TradingView. Baca dengan lebih lanjut di Terma Penggunaan.
Penafian
Maklumat dan penerbitan adalah tidak dimaksudkan untuk menjadi, dan tidak membentuk, nasihat untuk kewangan, pelaburan, perdagangan dan jenis-jenis lain atau cadangan yang dibekalkan atau disahkan oleh TradingView. Baca dengan lebih lanjut di Terma Penggunaan.