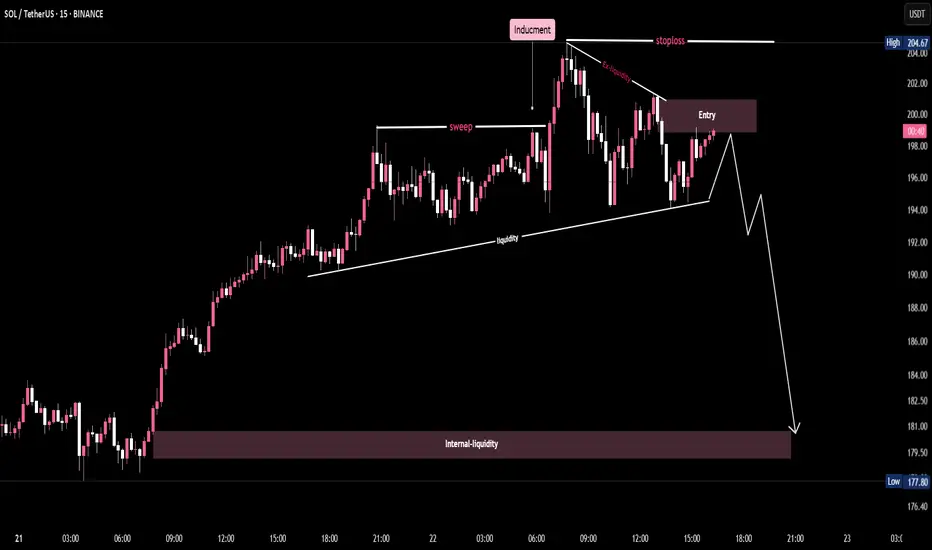
🔑 Key Points from the Chart:
1.Inducement:
A price level engineered to trap breakout traders before reversing.
The chart shows a false breakout above the previous high, which induces buyers.
2.Sweep:
The market sweeps the prior highs (liquidity grab), enticing breakout traders.
Price shortly reverses after triggering stop orders above.
3.Ex-Liquidity (External Liquidity):
Refers to stop-loss clusters above the high.
This liquidity is taken out, leading to a reversal.
4.Entry Zone:
A supply zone where the price revisits after the sweep.
Ideal short entry indicated in the maroon box.
5.Stoploss:
Placed above the inducement high (post-sweep high).
Clearly labeled to show safe invalidation zone.
T6.rendline Liquidity:
Diagonal support connecting higher lows.
Acts as a trap—once broken, confirms bearish intent.
7.Internal Liquidity:
Major demand zone where price is expected to head next.
Target for the short setup, marked in a large maroon rectangle.
8.Projected Price Path:
White line showing expected bearish move.
Aims for internal liquidity zone below $181.
Dagangan ditutup: hentian tercapai
SOL turned bearish after the liquidity at slightly above the SL.Penafian
Maklumat dan penerbitan adalah tidak dimaksudkan untuk menjadi, dan tidak membentuk, nasihat untuk kewangan, pelaburan, perdagangan dan jenis-jenis lain atau cadangan yang dibekalkan atau disahkan oleh TradingView. Baca dengan lebih lanjut di Terma Penggunaan.
Penafian
Maklumat dan penerbitan adalah tidak dimaksudkan untuk menjadi, dan tidak membentuk, nasihat untuk kewangan, pelaburan, perdagangan dan jenis-jenis lain atau cadangan yang dibekalkan atau disahkan oleh TradingView. Baca dengan lebih lanjut di Terma Penggunaan.