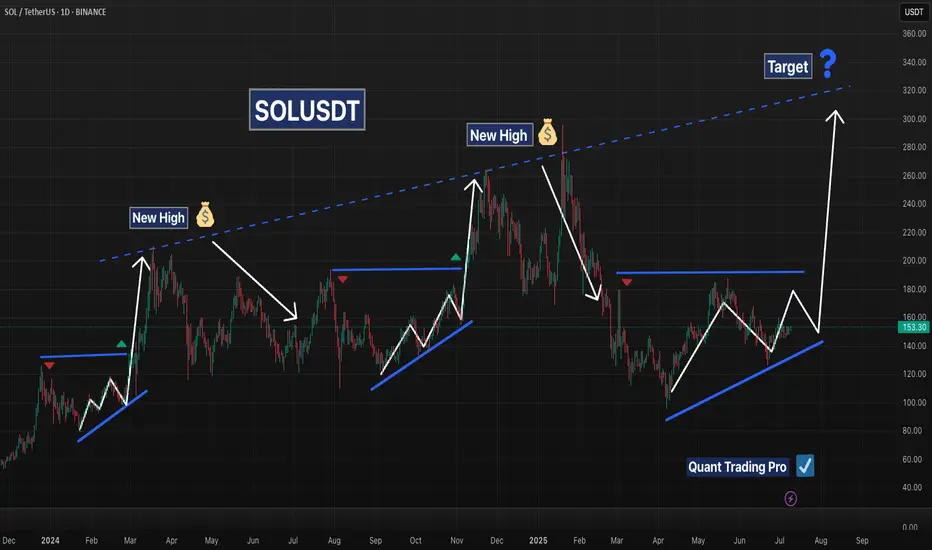
Solana’s chart reveals a recurring bullish pattern that has played out multiple times over the past year. In each instance, SOL formed a rising base or ascending triangle followed by a strong breakout and a new high. These breakouts typically occurred after:
A series of higher lows forming an ascending structure
Compression beneath horizontal resistance
A clean breakout followed by a rapid price expansion
The current price action appears to be forming the same structure once again:
A clear ascending support trendline is intact
Price is approaching the horizontal resistance zone near $180
The 50 EMA is turning upward and price is pressing above the 200 EMA
If SOL breaks above the $180 level with volume, it could mirror previous rallies and target the long-term diagonal resistance trendline, currently pointing toward the $300–$340 range. Until then, a pullback to retest support near $140–$150 would remain within the bullish structure.
Key Technical Features:
Consistent ascending accumulation patterns
Breakout levels followed by new highs
Current setup showing a third rising base near major resistance
Clear long-term diagonal trendline acting as a historical ceiling
This is a textbook example of price memory and structural repetition. Traders should monitor for a confirmed breakout above horizontal resistance with strong volume before positioning for continuation.
Explore 5,000 Strategies at quanttradingpro.com
Search for the most profitable, lowest risk by symbol!
Search by indicators like Supertrend, Ichimoku, macd.
Join our discord discord.gg/2systG9frc
We provide education & tools.
Search for the most profitable, lowest risk by symbol!
Search by indicators like Supertrend, Ichimoku, macd.
Join our discord discord.gg/2systG9frc
We provide education & tools.
Penafian
Maklumat dan penerbitan adalah tidak dimaksudkan untuk menjadi, dan tidak membentuk, nasihat untuk kewangan, pelaburan, perdagangan dan jenis-jenis lain atau cadangan yang dibekalkan atau disahkan oleh TradingView. Baca dengan lebih lanjut di Terma Penggunaan.