Stock Analysis: Soma Textiles & Industries Ltd (NSE: SOMATEX)
Step 1: Chart Analysis & Price Action Assessment
The stock shows multiple distinct price phases over the past year
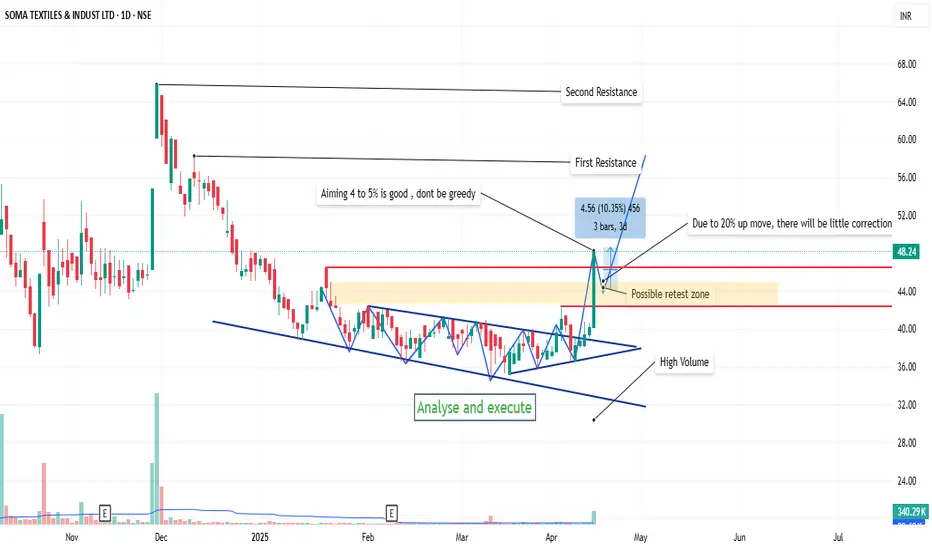
Currently trading at ₹48.24, up significantly by 20% for the day with elevated volume (340.29K)
Price history shows a strong rally in October-November 2024 (₹35 to ₹67), followed by a correction
Since January 2025, the stock has been trading in a range between ₹36-₹44
Today's large green candle represents a potential breakout from this recent consolidation
Step 2: Volume & Volatility Analysis
Current volume (340.29K) is substantially higher than recent average trading volumes
Significant volume spikes visible during key trend changes in October and November 2024
Prior to today's move, volume has been relatively low during the recent consolidation phase
Today's price action shows a dramatic expansion in volatility after a period of contracted price movement
Step 3: Phase Classification
The stock appears to be transitioning from Stage 1 (Consolidation) to early Stage 2 (Accumulation) with these supporting factors:
The stock completed a Stage 3 growth phase in November 2024 (reaching ₹67)
Since December 2024, it has been in a corrective phase followed by consolidation
Recent price action formed a stable base in the ₹36-₹44 range for several months
Today's strong price surge with high volume suggests the beginning of a new accumulation phase
Step 4: Final Summary & Recommended Action
Key Observations:
Trend Direction: Potential trend reversal from sideways to upward
Volume Behavior: Significant spike on today's breakout (340.29K)
Volatility: Expanding after a period of contraction
Support & Resistance Levels: Support at ₹40-₹42, Resistance at ₹52-₹54
Suggested Strategy:
The stock appears to be transitioning from consolidation into a potential new accumulation phase, with strong confirmation signals from today's price and volume action.
Final Action Plan:
BUY - The 20% price surge on high volume after a prolonged consolidation phase suggests a potentially significant trend change:
Enter a position with clear risk parameters:
Entry near current levels or on a pullback to ₹44-₹45
Set stop-loss below the recent consolidation range (around ₹38-₹39)
Initial target at previous resistance around ₹52-₹54, with potential for further upside if the trend develops
Monitor for confirmation signals:
Continued strong volume on up days
Constructive consolidation following today's move rather than a complete reversal
Price holding above the breakout level on subsequent trading sessions
This setup shows classic characteristics of a Stage 1 to Stage 2 transition, with the 20% move on high volume providing a strong initial signal. The clear support levels from the recent consolidation provide a defined risk management point.
Penafian
Maklumat dan penerbitan adalah tidak dimaksudkan untuk menjadi, dan tidak membentuk, nasihat untuk kewangan, pelaburan, perdagangan dan jenis-jenis lain atau cadangan yang dibekalkan atau disahkan oleh TradingView. Baca dengan lebih lanjut di Terma Penggunaan.
Penafian
Maklumat dan penerbitan adalah tidak dimaksudkan untuk menjadi, dan tidak membentuk, nasihat untuk kewangan, pelaburan, perdagangan dan jenis-jenis lain atau cadangan yang dibekalkan atau disahkan oleh TradingView. Baca dengan lebih lanjut di Terma Penggunaan.
