Sonata Software Ltd-
technical + fundamental analysis based on chart and industry outlook 👇
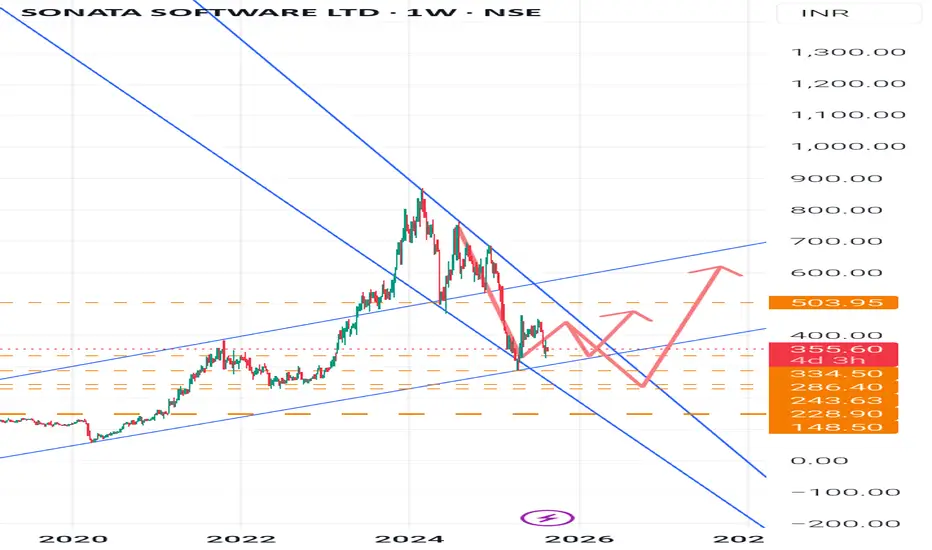
Technical Chart Analysis (Weekly Chart)
Current Price: 356.40
Trend: The stock had a steep rally till 1,200 and then corrected sharply into a downtrend channel. Now it is stabilizing and attempting a base formation.
- Support Levels
334 - immediate support
286 - strong support zone
243 - medium-term support
228 - long-term crucial base
148 - major bottom support
- Resistance Levels
400 - near-term hurdle
503 - key weekly resistance (breakout confirmation if crossed)
600 - medium-term target if trend sustains
700+ - only after strong momentum breakout
- Chart Pattern
Stock is currently consolidating between 330-400.
Possible formation of a W-bottom / double bottom, if 330-334 holds.
A sustained move above 503 could trigger a trend reversal rally toward 600-700.
If it breaks below 286, weakness may extend to 243/228 zone.
🏢 Business & Competition
Sonata Software operates in IT services, cloud, and digital transformation. It earns revenues from export-oriented IT services, particularly in Microsoft ecosystem solutions.
- Key Competitors
Mid-cap IT peers: Mphasis, L&T Technology, Persistent Systems, Coforge, Birlasoft, Mindtree (merged into LTIMindtree).
Sonata is relatively smaller in scale compared to peers but has a niche in Microsoft Dynamics 365 solutions.
📈 Fundamental Ratios (Latest available FY24 data)
Market Cap: 9,500 Cr
P/E Ratio: 27 (mid-cap IT avg. 30-35) - slightly undervalued compared to peers
ROE (Return on Equity): 25% - very strong
ROCE (Return on Capital Employed): 30% - efficient capital use
Debt-to-Equity: 0.05 - virtually debt-free
Dividend Yield: 1.5% - decent payout for investors
Revenue Growth (3Y CAGR): 15-18%
EPS Growth (3Y CAGR): 20%
👍 Investment View
Technicals: Base building in progress. Sustaining above the 400-503 zone is crucial for the next uptrend.
Fundamentals: Strong ROE/ROCE, debt-free, consistent dividend payer. Attractive in mid-cap IT basket.
Risks: Global IT slowdown, client concentration risk, strong USD-INR dependency.
👉Disclaimer
This analysis is for educational & informational purposes only.
It is not financial advice or a buy/sell recommendation.
Stock markets are subject to risks - please consult your financial advisor before making any investment decisions.
#sonatasoftware #trendanalysis #chartpattern
technical + fundamental analysis based on chart and industry outlook 👇
Technical Chart Analysis (Weekly Chart)
Current Price: 356.40
Trend: The stock had a steep rally till 1,200 and then corrected sharply into a downtrend channel. Now it is stabilizing and attempting a base formation.
- Support Levels
334 - immediate support
286 - strong support zone
243 - medium-term support
228 - long-term crucial base
148 - major bottom support
- Resistance Levels
400 - near-term hurdle
503 - key weekly resistance (breakout confirmation if crossed)
600 - medium-term target if trend sustains
700+ - only after strong momentum breakout
- Chart Pattern
Stock is currently consolidating between 330-400.
Possible formation of a W-bottom / double bottom, if 330-334 holds.
A sustained move above 503 could trigger a trend reversal rally toward 600-700.
If it breaks below 286, weakness may extend to 243/228 zone.
🏢 Business & Competition
Sonata Software operates in IT services, cloud, and digital transformation. It earns revenues from export-oriented IT services, particularly in Microsoft ecosystem solutions.
- Key Competitors
Mid-cap IT peers: Mphasis, L&T Technology, Persistent Systems, Coforge, Birlasoft, Mindtree (merged into LTIMindtree).
Sonata is relatively smaller in scale compared to peers but has a niche in Microsoft Dynamics 365 solutions.
📈 Fundamental Ratios (Latest available FY24 data)
Market Cap: 9,500 Cr
P/E Ratio: 27 (mid-cap IT avg. 30-35) - slightly undervalued compared to peers
ROE (Return on Equity): 25% - very strong
ROCE (Return on Capital Employed): 30% - efficient capital use
Debt-to-Equity: 0.05 - virtually debt-free
Dividend Yield: 1.5% - decent payout for investors
Revenue Growth (3Y CAGR): 15-18%
EPS Growth (3Y CAGR): 20%
👍 Investment View
Technicals: Base building in progress. Sustaining above the 400-503 zone is crucial for the next uptrend.
Fundamentals: Strong ROE/ROCE, debt-free, consistent dividend payer. Attractive in mid-cap IT basket.
Risks: Global IT slowdown, client concentration risk, strong USD-INR dependency.
👉Disclaimer
This analysis is for educational & informational purposes only.
It is not financial advice or a buy/sell recommendation.
Stock markets are subject to risks - please consult your financial advisor before making any investment decisions.
#sonatasoftware #trendanalysis #chartpattern
Penerbitan berkaitan
Penafian
Maklumat dan penerbitan adalah tidak bertujuan, dan tidak membentuk, nasihat atau cadangan kewangan, pelaburan, dagangan atau jenis lain yang diberikan atau disahkan oleh TradingView. Baca lebih dalam Terma Penggunaan.
Penerbitan berkaitan
Penafian
Maklumat dan penerbitan adalah tidak bertujuan, dan tidak membentuk, nasihat atau cadangan kewangan, pelaburan, dagangan atau jenis lain yang diberikan atau disahkan oleh TradingView. Baca lebih dalam Terma Penggunaan.