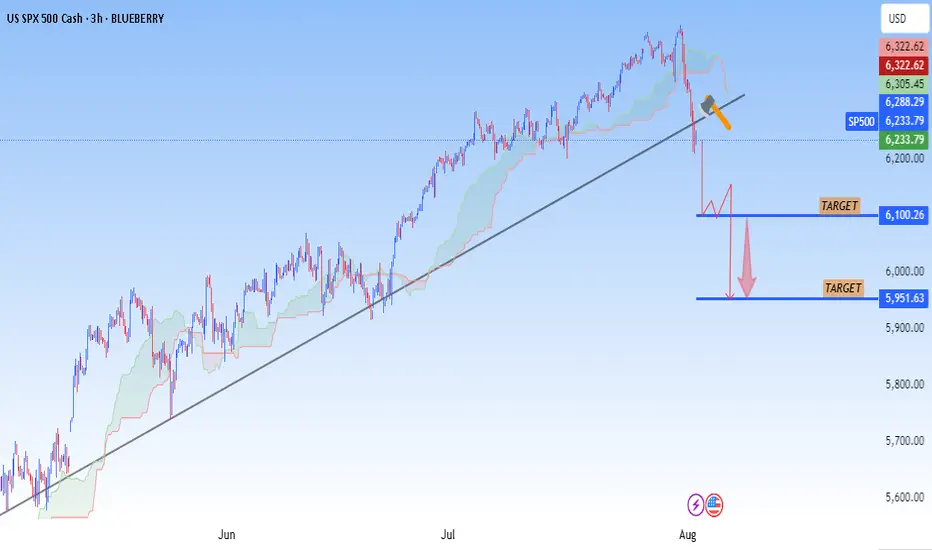
Chart Analysis (Sell Setup Identified):
A major ascending trendline has been broken.
A retest of the broken trendline is marked with an orange arrow.
This suggests a potential bearish reversal setup — perfect for a sell setup.
The chart already has two clear targets marked below.
---
🎯 Sell Entry Target:
You should consider entering a sell position near the retest zone:
Sell Entry Zone: Around 6,290 – 6,310 (Where price is retesting the trendline)
---
📉 Sell Setup Targets:
1. Target 1: 6,100.26
✅ Take partial profits here
🛡 You can also move stop loss to breakeven
2. Target 2: 5,951.43
🎯 Final target (strong support level)
---
⛔ Stop Loss (SL):
Place SL above the retest candle or just above trendline:
Around 6,330 – 6,345
---
Summary:
Type: Sell setup (bearish trendline break + retest)
Entry: 6,290 – 6,310
Stop Loss: 6,330 – 6,345
Targets:
• TP1: 6,100
• TP2: 5,951
✅JOIN FREE TELEGRAM
✅t.me/+atTT3a4htZ8yZjQ0
✅DAILY 3-4 SIGNALS
✅ALL PAIRS CRYPTO & GOLD
✅t.me/+atTT3a4htZ8yZjQ0
✅DAILY 3-4 SIGNALS
✅ALL PAIRS CRYPTO & GOLD
Penafian
Maklumat dan penerbitan adalah tidak dimaksudkan untuk menjadi, dan tidak membentuk, nasihat untuk kewangan, pelaburan, perdagangan dan jenis-jenis lain atau cadangan yang dibekalkan atau disahkan oleh TradingView. Baca dengan lebih lanjut di Terma Penggunaan.
