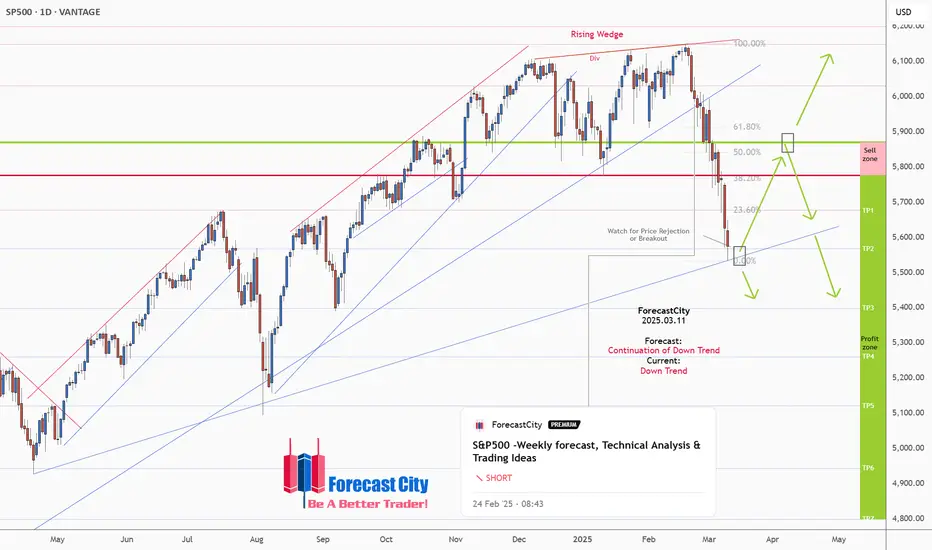
Midterm forecast:
$S&P500
Technical analysis:
Take Profits:
__________________________________________________________________
❤️ If you find this helpful and want more FREE forecasts in TradingView,
. . . . . . . . Hit the 'BOOST' button 👍
. . . . . . . . . . . Drop some feedback in the comments below! (e.g., What did you find most useful? How can we improve?)
🙏 Your support is appreciated!
Now, it's your turn!
Be sure to leave a comment; let us know how you see this opportunity and forecast.
Have a successful week,
ForecastCity Support Team
- 5870.56 is a major resistance, while this level is not broken, the Midterm wave will be downtrend.
$S&P500
Technical analysis:
- A peak is formed in daily chart at 6150.05 on 02/19/2025, so more losses to support(s) 5568.78, 5398.95, 5261.00 and more depths is expected.
Take Profits:
- 5677.80
- 5568.78
- 5398.95
- 5261.00
- 5122.47
- 4944.41
- 4800.00
__________________________________________________________________
❤️ If you find this helpful and want more FREE forecasts in TradingView,
. . . . . . . . Hit the 'BOOST' button 👍
. . . . . . . . . . . Drop some feedback in the comments below! (e.g., What did you find most useful? How can we improve?)
🙏 Your support is appreciated!
Now, it's your turn!
Be sure to leave a comment; let us know how you see this opportunity and forecast.
Have a successful week,
ForecastCity Support Team
High Accurate forecasts by 4CastMachine AI
✅36 Forex Pairs
✅175 Cryptos
✅16 Indices
✅Gold, Silver...
👉Follow.ForecastCity.com
FREE Telegrams:
👉t.me/ForecastCity_com
👉t.me/Free_Forex_AI
👉t.me/Free_Crypto_AI
✅36 Forex Pairs
✅175 Cryptos
✅16 Indices
✅Gold, Silver...
👉Follow.ForecastCity.com
FREE Telegrams:
👉t.me/ForecastCity_com
👉t.me/Free_Forex_AI
👉t.me/Free_Crypto_AI
Penerbitan berkaitan
Penafian
Maklumat dan penerbitan adalah tidak dimaksudkan untuk menjadi, dan tidak membentuk, nasihat untuk kewangan, pelaburan, perdagangan dan jenis-jenis lain atau cadangan yang dibekalkan atau disahkan oleh TradingView. Baca dengan lebih lanjut di Terma Penggunaan.
