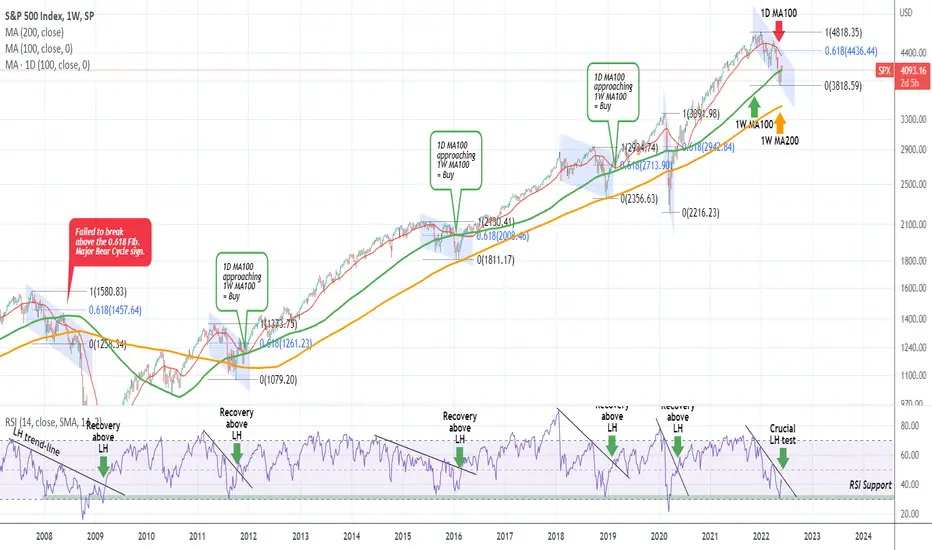
The S&P500 index (SPX) broke back above the 1W MA100 (green trend-line), which it lost as a Support early in May. This is a trend-line that has broken in all of major corrections (4 in total) since the 2008/09 Bear Cycle of the Subprime mortgage crisis. So is this simply such a correction or the start of a new Bear Cycle? Let's see a few markers that played an important role in the past.
** The 1W RSI Lower Highs trend-line **
First and foremost, since the May 16 2022 1W candle (this analysis is on the 1W (weekly) time-frame), the RSI has been rising towards the Lower Highs (LH) trend-line formed from the recent High (All Time High to be exact). In all previous corrections, once the price broke above this LH trend-line, then the trend resumed the bullish course. Note that the RSI rebound is coming after an exact hit on the 30.00 RSI level, which is the bottom of its multi-year Support Zone. This Support Zone has broken only twice in the past 14 years: near the end of the 2008/09 Bear Cycle and on March 2020 during the panic sale amidst the COVID outbreak. Also, regarding the LH trend-line, we have to mention that it marginally broke in late October 2015 but still the index made a new Low. So we have to give this line some room even if it breaks soon.
** The role of the 1W MA200 and 1D MA100 and the key Buy Signal **
Every correction hit the 1W MA200 (orange trend-line) after breaking the 1W MA100. Currently that is around 3495. There are two cases in which this can be avoided. First, as mentioned above, if the 1W RSI breaks above its LH trend-line. And second, if the 1D MA100 (red trend-line) approaches or even better hit the 1W MA100 prior. Those two are very close now. Once they converge, that is historically the strongest long-term buy signal in recent years.
** The 0.618 Fibonacci as the difference between a correction and a Bear Cycle **
A critical marker as well, is the 0.618 Fibonacci retracement level. This may as well be called 'the difference between a Bull correction and a Bear Cycle'. As you see, the 0.618 Fib level from the bottom has always broken on every correction but failed to break the one time which later turned out to be the subprime Bear Market. Assuming May's low is the bottom, the 0.618 Fib is currently around 4435. That means that if it breaks, we can call the value loss since the start of the year, a correction and not the start of a Bear Cycle.
** Conclusion **
Well there is not much to be said in an analysis like this, the chart is pretty much self-explanatory. Perhaps what you can keep as a long-term investor/ trader is that you can either buy again with a relative degree of safety either above the 0.618 Fib (4435) or when the 1W RSI breaks its Lower Highs and the 1D MA100 comes close (or touches) the 1W MA100. As you see such patterns turn to pay big with the lowest possible risk and are rarely presented opportunities.
--------------------------------------------------------------------------------------------------------
Please like, subscribe and share your ideas and charts with the community!
--------------------------------------------------------------------------------------------------------
👑Best Signals (Forex/Crypto+70% accuracy) & Account Management (+20% profit/month on 10k accounts)
💰Free Channel t.me/tradingshotglobal
🤵Contact info@tradingshot.com t.me/tradingshot
🔥New service: next X100 crypto GEMS!
💰Free Channel t.me/tradingshotglobal
🤵Contact info@tradingshot.com t.me/tradingshot
🔥New service: next X100 crypto GEMS!
Penafian
The information and publications are not meant to be, and do not constitute, financial, investment, trading, or other types of advice or recommendations supplied or endorsed by TradingView. Read more in the Terms of Use.