Here is the 1st chart I did of SPX back in Jan 2022:

I called the drop to the yellow line on chart. Nailed it to nearly the exact $.
Then in October 2023 I mentioned this:

The rally was confirmed for the next 6 months minimum.
Then in Jan 2024 I posted a red horizontal line as target for the rally:

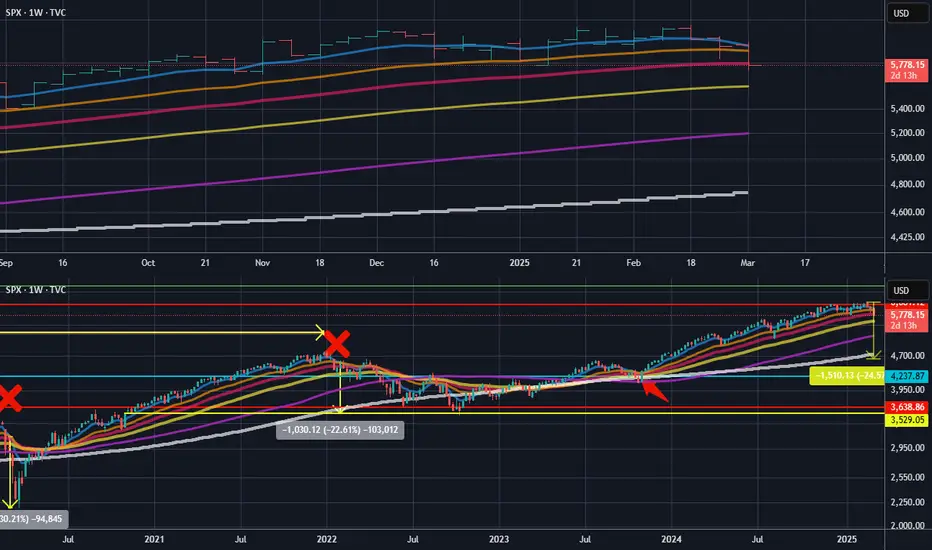
Now you can see on current bottom chart that price hit the red line target.
This chart setup you see on bottom chart also shows relevance to the 1st chart I did on SPX where when the blue EMA8 went below the orange MA21, a drop happened as per the red X marks and price changes shown on chart. This is close to happening currently which is easier to see on the top chart as I give a close up view on current price action and the EMA/MA's.
Are we about to see a drop as per yellow price change on chart or can SPX bounce from here and move up to the green horizontal line on chart? The EMA/MA crossunder will tell us.
Even though I called the moves all correct previously, at this time in the markets, things are alot trickier so I cannot say with conviction this time around as to which way it will go.
I will update the analysis once the bounce or cross under is confirmed.
I called the drop to the yellow line on chart. Nailed it to nearly the exact $.
Then in October 2023 I mentioned this:
The rally was confirmed for the next 6 months minimum.
Then in Jan 2024 I posted a red horizontal line as target for the rally:
Now you can see on current bottom chart that price hit the red line target.
This chart setup you see on bottom chart also shows relevance to the 1st chart I did on SPX where when the blue EMA8 went below the orange MA21, a drop happened as per the red X marks and price changes shown on chart. This is close to happening currently which is easier to see on the top chart as I give a close up view on current price action and the EMA/MA's.
Are we about to see a drop as per yellow price change on chart or can SPX bounce from here and move up to the green horizontal line on chart? The EMA/MA crossunder will tell us.
Even though I called the moves all correct previously, at this time in the markets, things are alot trickier so I cannot say with conviction this time around as to which way it will go.
I will update the analysis once the bounce or cross under is confirmed.
Penerbitan berkaitan
Penafian
Maklumat dan penerbitan adalah tidak dimaksudkan untuk menjadi, dan tidak membentuk, nasihat untuk kewangan, pelaburan, perdagangan dan jenis-jenis lain atau cadangan yang dibekalkan atau disahkan oleh TradingView. Baca dengan lebih lanjut di Terma Penggunaan.
Penerbitan berkaitan
Penafian
Maklumat dan penerbitan adalah tidak dimaksudkan untuk menjadi, dan tidak membentuk, nasihat untuk kewangan, pelaburan, perdagangan dan jenis-jenis lain atau cadangan yang dibekalkan atau disahkan oleh TradingView. Baca dengan lebih lanjut di Terma Penggunaan.