Technical Analysis and Outlook:
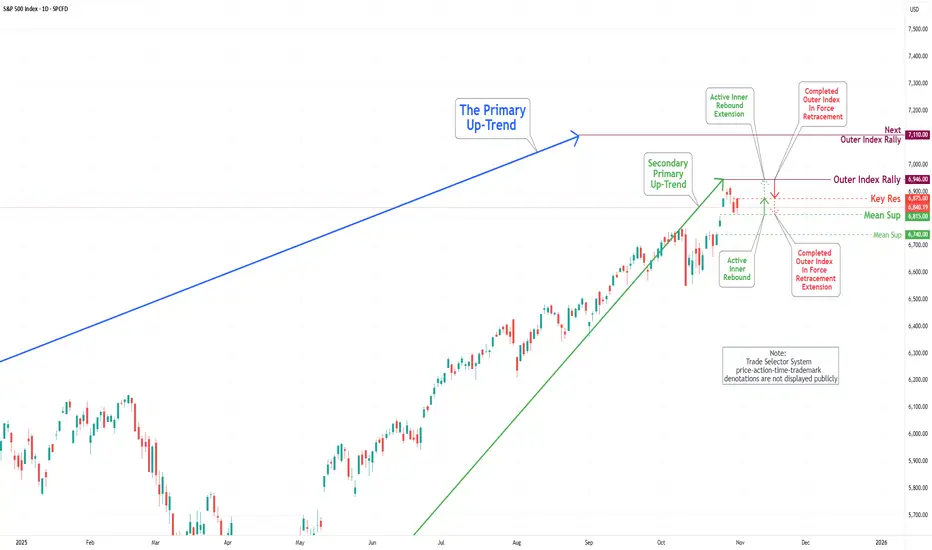
During the recent trading session, the S&P 500 Index continued its wild ride, highlighting the importance of our key target, which stands as an Outer Index Rally at 6946. Fluctuations between the Mean Support at 6815 and the Key Resistance at 6875 serve as a crucial threshold for market participants. This positioning suggests the potential for further upward momentum, as the prevailing trend indicates a well-structured Active Inner Rebound extension toward the target stated above.
Nevertheless, it is essential to acknowledge the possibility of a sustained and gradual pullback within the current Active Inner Rebound zone. Such a pullback may retest the Mean Support at 6815 and could decline further to the Mean Support at 6740 before ultimately resuming an upward trajectory.
Penerbitan berkaitan
Penafian
Maklumat dan penerbitan adalah tidak bertujuan, dan tidak membentuk, nasihat atau cadangan kewangan, pelaburan, dagangan atau jenis lain yang diberikan atau disahkan oleh TradingView. Baca lebih dalam Terma Penggunaan.
Penerbitan berkaitan
Penafian
Maklumat dan penerbitan adalah tidak bertujuan, dan tidak membentuk, nasihat atau cadangan kewangan, pelaburan, dagangan atau jenis lain yang diberikan atau disahkan oleh TradingView. Baca lebih dalam Terma Penggunaan.