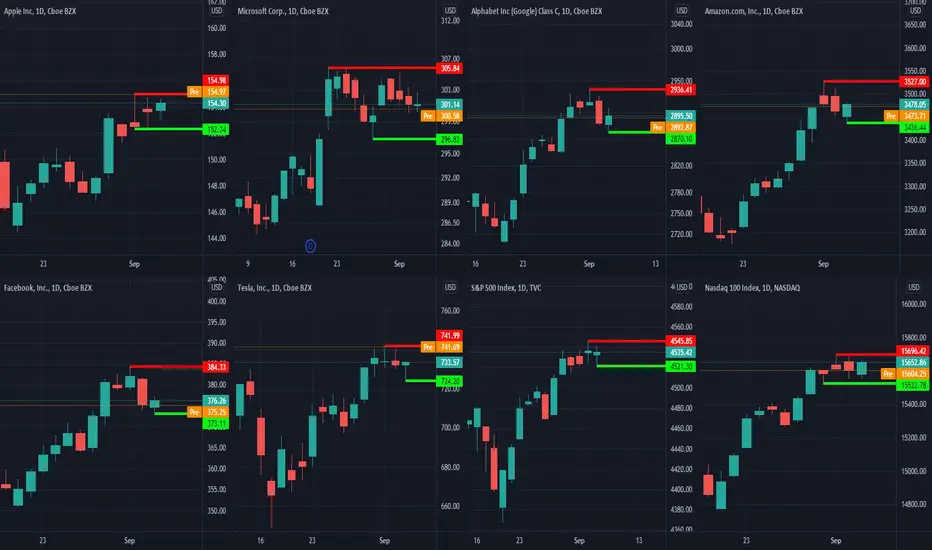
Looking at the price pattern of the biggest companies in the market (AAPL, MSFT, GOOG, AMZN, FB, TSLA) and the major indexes (S&P500 and NASDAQ 100) clearly shows Bulls and Bears power is reaching a new equilibrium.
after a Bullish rally that pushes prices higher in August 2021, we see multiple candles with small bodies(Doji) in the charts and prices went sideways in the past few days.
In a situation like this, the best decision could be being patient and waiting for breakouts.
Red lines: show the most important resistance levels, closing above these levels will enhance higher prices.
Green lines: show the most important support levels, closing below these levels will enhance lower prices.
Please be careful, crossing above or below these levels could be what we call a "Trap" in price patterns.
“This company looks cheap, that company looks cheap, but the overall economy could completely screw it up. The key is to wait. Sometimes the hardest thing to do is to do nothing.” David Tepper
Use the following link to access trading ideas: patreon.com/SniperTraderStocks?utm_medium=unknown&utm_source=join_link&utm_campaign=creatorshare_creator&utm_content=copyLink
Penafian
The information and publications are not meant to be, and do not constitute, financial, investment, trading, or other types of advice or recommendations supplied or endorsed by TradingView. Read more in the Terms of Use.