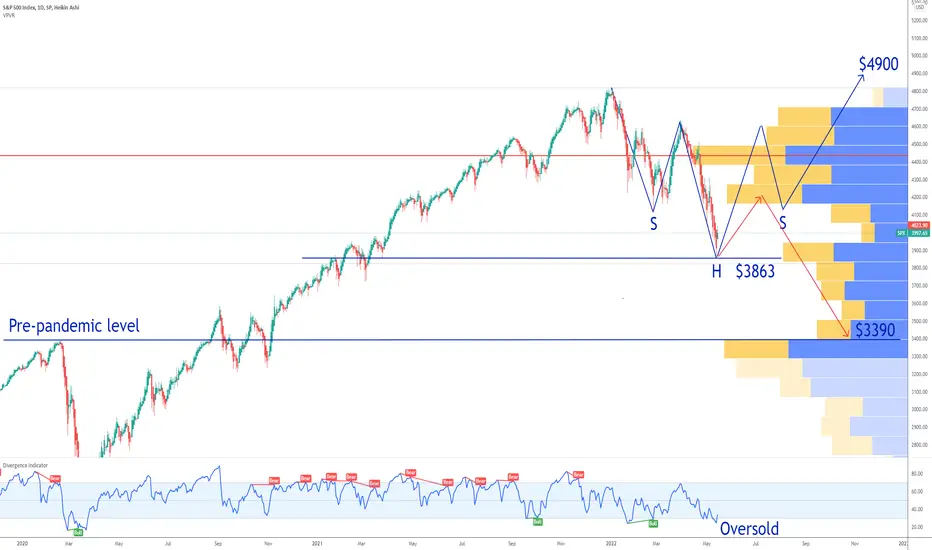
We are on the daily timeframe and we can see that historically buying the S&P index on RSI lower than 30 is an opportunity.
Current S&P 500 PE Ratio is decent: 20.34
Min: 5.31 (Dec 1917)
Max: 123.73 (May 2009)
I have 2 scenarios:
1. Inverse head and shoulders chart pattern with a price target of $4900 by the end of the year.
2. Worst case scenario: bull trap at $4150 an retracement to the pre-pandemic level of $3390. I tend not to believe this scenario because of the too low price per earnings ratio of the S&P.
Looking forward to read your opinion about it.
Private SIGNALS patreon.com/PremiumOptionsSignals
Trading COURSE bit.ly/tradex
RESULTS bit.ly/TG10x
TradeNation bit.ly/t10X
CRYPTO partner.bybit.com/b/37880
BUY-SELL INDICATORS tradingindicators.store/
Trading COURSE bit.ly/tradex
RESULTS bit.ly/TG10x
TradeNation bit.ly/t10X
CRYPTO partner.bybit.com/b/37880
BUY-SELL INDICATORS tradingindicators.store/
Penafian
Maklumat dan penerbitan adalah tidak dimaksudkan untuk menjadi, dan tidak membentuk, nasihat untuk kewangan, pelaburan, perdagangan dan jenis-jenis lain atau cadangan yang dibekalkan atau disahkan oleh TradingView. Baca dengan lebih lanjut di Terma Penggunaan.
