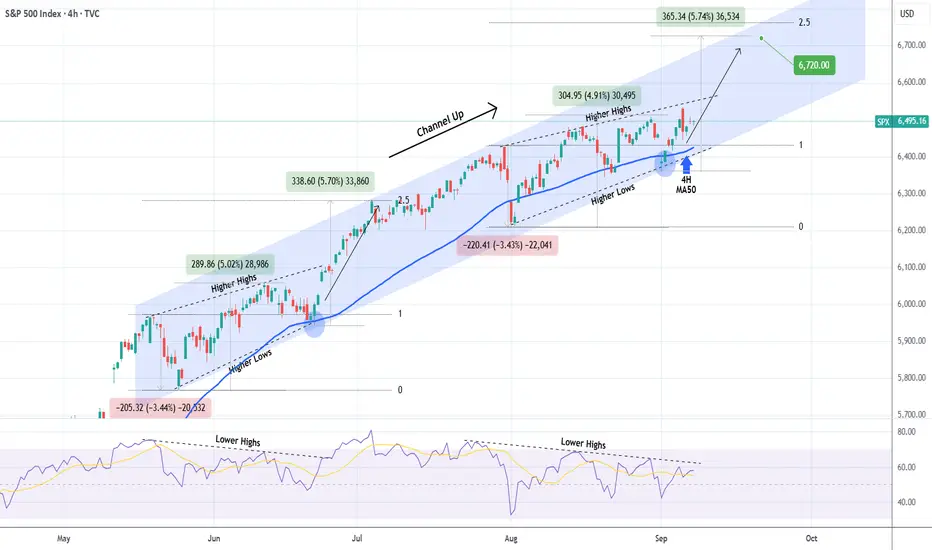
Last week's (September 02, see chart below) buy signal on the S&P500 index (SPX) hit our 6530 Target, as the price reversed on its 4H MA200, which as we mentioned was the market's medium-term Support:

Right now the index is supported by its 4H MA50 (blue trend-line) and is attempting to break above the top (Higher Highs trend-line) of a Rising Wedge similar to the one at the start of the 4-month Channel Up.
As you can see the symmetry between the two patterns is very high and the June break-out led to a +5.70% rise on the 2.5 Fibonacci extension before the next consolidation. A potential +5.70% rise from he recent 4H MA50 Low would now be at 6720 and that is our short-term Target.
-------------------------------------------------------------------------------
** Please LIKE 👍, FOLLOW ✅, SHARE 🙌 and COMMENT ✍ if you enjoy this idea! Also share your ideas and charts in the comments section below! This is best way to keep it relevant, support us, keep the content here free and allow the idea to reach as many people as possible. **
-------------------------------------------------------------------------------
💸💸💸💸💸💸
👇 👇 👇 👇 👇 👇
👑Best Signals (Forex/Crypto+70% accuracy) & Account Management (+20% profit/month on 10k accounts)
💰Free Channel t.me/tradingshotglobal
🤵Contact info@tradingshot.com t.me/tradingshot
🔥New service: next X100 crypto GEMS!
💰Free Channel t.me/tradingshotglobal
🤵Contact info@tradingshot.com t.me/tradingshot
🔥New service: next X100 crypto GEMS!
Penafian
Maklumat dan penerbitan adalah tidak dimaksudkan untuk menjadi, dan tidak membentuk, nasihat untuk kewangan, pelaburan, perdagangan dan jenis-jenis lain atau cadangan yang dibekalkan atau disahkan oleh TradingView. Baca dengan lebih lanjut di Terma Penggunaan.