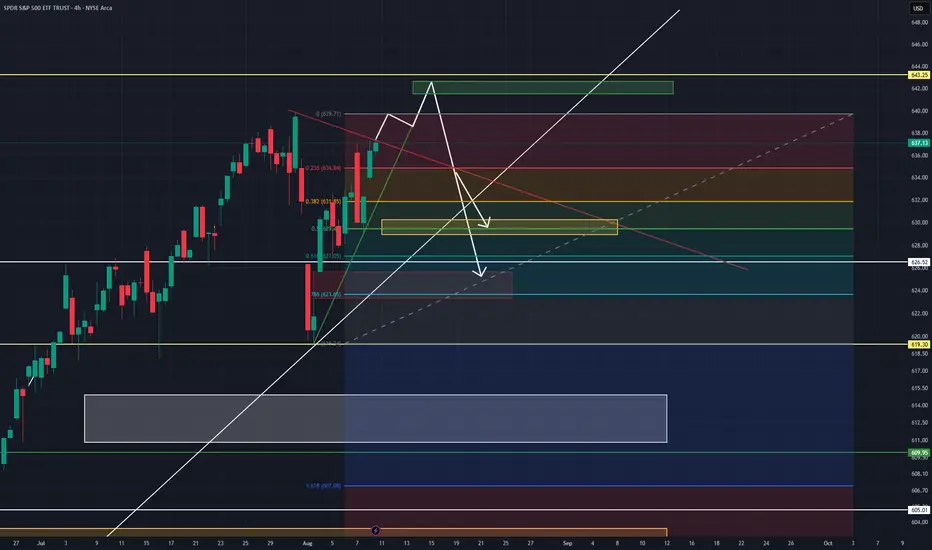
This week watching  SPY I am looking at the Spy's rsi on a few time frames wanting more bullishness but lacking the strength. Watching some data this week or any news- this might be the catalyst to achieve the clear want for more upside (642-645) before any further flush. I see us, in this bullish case, to touch highs again and possibly test it or go a bit higher before playing out the bearish divergence and weakness that has been showing on the Adx, rsi, and price action (candles) over the last 2 weeks. I still see a flush this weak based on lack of strength in adx, and rsi possibly down to 624- 619 if not this week, next.
I also see the possibility due to weakness again that we drop immediately this week instead of a 14 day outlook this could very well be playing out this week, again maybe with the assistance of the data incoming this week. In this case if we drop before Wednesday I feel like the weakness will possibly be completed and we will see returning bullishness by end of week Friday or Monday- Tuesday next week. We are very low on the adx, meaning I do see big movement coming and good opportunity to be Ready and Prepared.
watch key support and resistance lines drawn horizontally and angled around trends and gathering of price action. A break of the lines could signal key support (bullishness) or key resistance (bearish) levels. Pay attention to places of interest and watch the bull v bear volume this next few days.
Penafian
Maklumat dan penerbitan adalah tidak bertujuan, dan tidak membentuk, nasihat atau cadangan kewangan, pelaburan, dagangan atau jenis lain yang diberikan atau disahkan oleh TradingView. Baca lebih dalam Terma Penggunaan.
Penafian
Maklumat dan penerbitan adalah tidak bertujuan, dan tidak membentuk, nasihat atau cadangan kewangan, pelaburan, dagangan atau jenis lain yang diberikan atau disahkan oleh TradingView. Baca lebih dalam Terma Penggunaan.