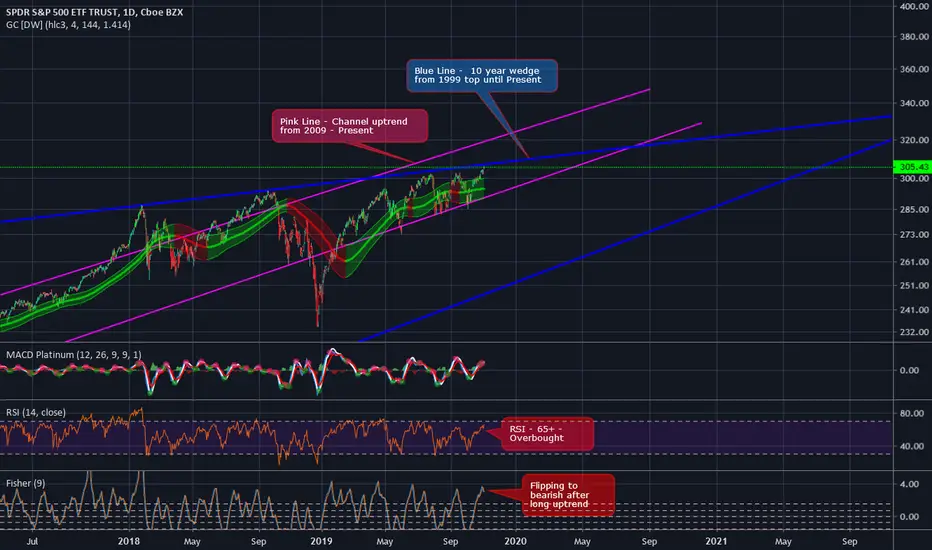
Daily view shows same pink channel (2009 to Present) and blue ascending wedge (1993-Present).
Price is currently hitting top of blue wedge.
RSI is overbought.
Fisher Transform turning down and bearish (orange on top of blue).
If we do go any higher, we should go down 5-8% before seeing a reversal or if further downtrend continues.
Either way this ascending wedge (like 15 years!!!) looks to end around April 2020.
I will post updates to this chart as we get closer to April 2020.
This is just my opinion. Please like, follow, or comment.
Penafian
Maklumat dan penerbitan adalah tidak bertujuan, dan tidak membentuk, nasihat atau cadangan kewangan, pelaburan, dagangan atau jenis lain yang diberikan atau disahkan oleh TradingView. Baca lebih dalam Terma Penggunaan.
Penafian
Maklumat dan penerbitan adalah tidak bertujuan, dan tidak membentuk, nasihat atau cadangan kewangan, pelaburan, dagangan atau jenis lain yang diberikan atau disahkan oleh TradingView. Baca lebih dalam Terma Penggunaan.