Price Action Analysis:
-Recent Action: Strong green candle with significant body suggesting institutional accumulation
-Candle Structure: Minimal upper shadow indicates buying pressure throughout the session
-Previous Action: Series of consolidation candles around ₹85-95 showing accumulation phase
-Breakout Candle: Wide-range bar breaking above downtrend resistance with conviction
Price Swing Analysis:
-Higher Highs/Higher Lows: Recent price action shows initial signs of trend reversal
-Momentum Shift: Price moving from range-bound to trending behaviour
-Gap Analysis: No significant gaps visible, suggesting organic price discovery
Volume Spread Analysis (VSA):
Current Weekly Bar Analysis:
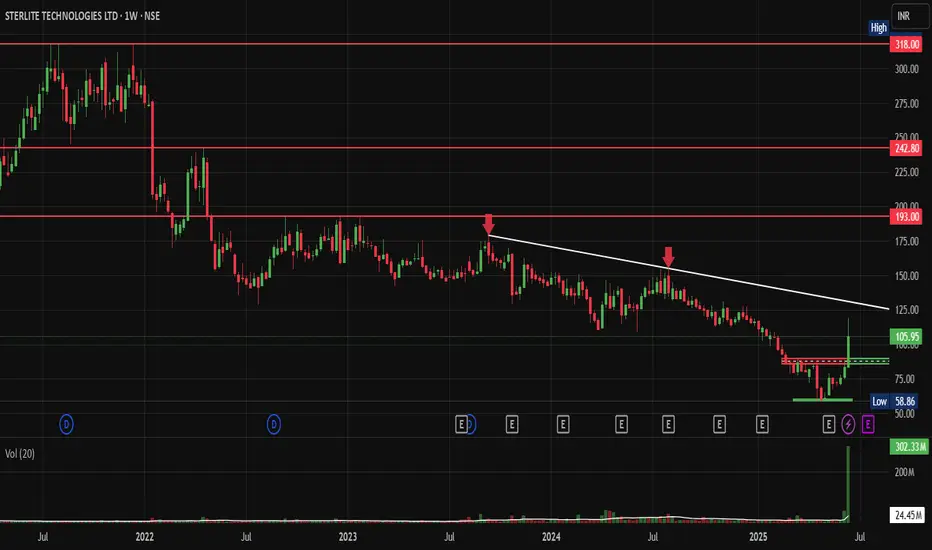
-Volume: 302.33M (Exceptionally high - 12x average volume)
-Spread: Wide range bar with substantial price movement
-Close Position: Closing in the upper 75% of the range
-VSA Interpretation: Professional Money Accumulation - High volume with wide spread and strong close
Volume-Price Relationship Breakdown:
Phase 1 (2022-2023): Distribution & Selling Climax
-High volume on down bars during the initial decline
-Volume spikes coinciding with major price drops
-Classic distribution pattern with professional selling
Phase 2 (2023-2024): Accumulation Phase
-No Supply Bars: Low volume on down bars indicates selling exhaustion
-Testing for Supply: Multiple tests of the ₹50-60 zone with reducing volume
-Background Volume: Consistently low volume, suggesting minimal selling pressure
Phase 3 (Late 2024-2025): Mark-up Beginning
-Effort vs Result: Increasing volume with improving price action
-Spring Action: False break below support, followed by quick recovery
-Current Bar: Classic "Upthrust After Accumulation" with massive volume
Volume Spread Analysis Summary:
Key VSA Signals Identified:
-Selling Climax: Evident in 2022 with high volume and wide down bars
-No Supply: Consistent pattern during 2023-2024 base formation
-Spring/Shakeout: Brief dip below ₹58 with immediate recovery
-Effort to Rise: Current massive volume surge on breakout attempt
-Professional Interest: Volume pattern suggests smart money accumulation
Chart Structure Breakdown:
-Base Formation: Classic Multi-Year Cup Base spanning approximately 3 years (2022-2025)
-Base Duration & Depth: 36+ months with a devastating 85% decline from peak (₹318 to ₹50 lows)
Volume Characteristics:
- Volume dried up significantly during the base formation phase
- Massive volume surge (302.33M vs 24.45M average) accompanying the recent breakout attempt
- Classic accumulation pattern with low volume during decline and high volume on breakout
Key Levels:
Support Levels:
- Primary Support: ₹58-60 (recent low and base formation floor)
- Secondary Support: ₹75-80 (previous resistance turned support)
Resistance Levels:
- Immediate Resistance: ₹125-130 (downtrend line resistance)
- Major Resistance: ₹193-200 (previous significant level)
- Ultimate Resistance: ₹242-250 (prior consolidation zone)
- Breakout Zone: ₹108-112 (current breakout level with volume confirmation)
Price Patterns:
-Primary Pattern: Multi-year Cup Base with potential Handle formation
-Current Action: Breakout from 3-year downtrend line with explosive volume
-Volume Confirmation: 12x volume surge validates the breakout authenticity
-Pattern Reliability: High probability setup given the extended base duration and volume characteristics
Trade Setup:
Entry Strategy:
Primary Entry: ₹110-112 on sustained breakout with volume above 50M
Add-on Entry: ₹115-118 on momentum continuation or successful retest of breakout zone
Early Entry: ₹105-107 for aggressive traders betting on breakout confirmation
Exit Strategy:
Initial Target: ₹140-145 (measured move from base depth)
Secondary Target: ₹175-180 (intermediate resistance zone)
Ultimate Target: ₹200+ (major resistance retest)
Trail SL: Use a 20% trailing stop once the initial target is achieved
Stop-Loss and Risk Management:
Ideal Stop-Loss: ₹95-98 (below breakout zone invalidation)
Conservative SL: ₹88-90 (below recent swing low with buffer)
Position Sizing: Risk 1.5-2% of portfolio capital given the high-conviction setup
Risk-Reward: Attractive 1:3 to 1:4 ratio to initial targets
Sectoral and Fundamental Backdrop:
Sector Outlook:
Sector: Telecom Infrastructure & Optical Fiber - benefiting from 5G rollout momentum
Relative Strength: Telecom capex cycle turning positive with the government's digital infrastructure push
Peer Performance: Optical fiber and telecom equipment stocks showing renewed interest
Stock Fundamentals:
Business Turnaround: The Company has been restructuring operations and reducing its debt burden
Growth Catalyst: 5G infrastructure deployment and the government's Digital India initiatives provide tailwinds
Financial Health: Improving operational efficiency, though still in recovery phase
Technical-Fundamental Alignment: Multi-year base formation coincides with business restructuring completion
Overall Trade Summary:
Reward-to-Risk Ratio: 3.5:1 to initial target, extending to 5:1+ for swing targets
Conviction Level: High- Textbook cup base with volume confirmation.
Ideal Trader Profile:
- Swing Traders: 4-8 week holding period for initial targets
- Positional Traders: 6-12 month horizon for major resistance retest
- Momentum Players: Quick 15-20% moves on breakout continuation
Key Insight: "After 3 years of pain, Sterlite Tech is displaying all the hallmarks of a classic turnaround story - the kind that can deliver multi-bagger returns for patient capital."
Key VSA Insight: "The 12x volume surge represents the moment when smart money stops accumulating and starts marking up - a classic VSA signal for trend initiation."
My Take:
Trade Thesis: This represents a high-probability, low-risk entry into a fundamentally improving story at a technically optimal juncture. The combination of multi-year base, volume breakout, and sector tailwinds creates a compelling risk-adjusted opportunity.
Keep in the Watchlist.
NO RECO. For Buy/Sell.
📌Thank you for exploring my idea! I hope you found it valuable.
🙏FOLLOW for more
👍BOOST if you found it useful.
✍️COMMENT below with your views.
Meanwhile, check out my other stock ideas on the right side until this trade is activated. I would love your feedback.
Disclaimer: "I am not a SEBI REGISTERED RESEARCH ANALYST AND INVESTMENT ADVISER."
This analysis is intended solely for informational and educational purposes and should not be interpreted as financial advice. It is advisable to consult a qualified financial advisor or conduct thorough research before making investment decisions.
Penerbitan berkaitan
Penafian
The information and publications are not meant to be, and do not constitute, financial, investment, trading, or other types of advice or recommendations supplied or endorsed by TradingView. Read more in the Terms of Use.
Penerbitan berkaitan
Penafian
The information and publications are not meant to be, and do not constitute, financial, investment, trading, or other types of advice or recommendations supplied or endorsed by TradingView. Read more in the Terms of Use.