🔎 Overview
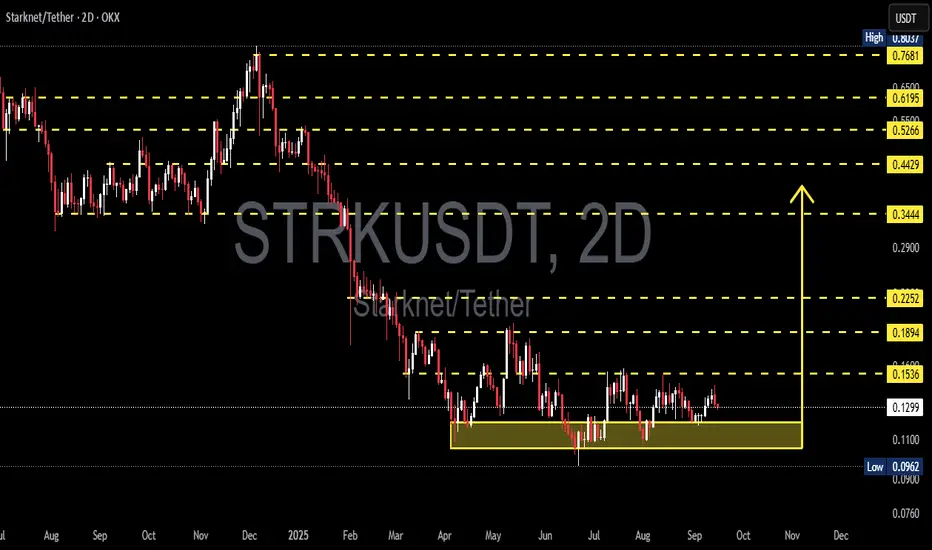
The STRK/USDT (2D) chart is showing a consolidation phase after a heavy downtrend since early 2025. Price is currently trading around 0.1299, hovering just above a key support zone at 0.096–0.11 (yellow box) which has been tested multiple times and continues to hold.
This structure resembles a rectangle accumulation pattern, often seen when buyers quietly build positions after a long selloff. If this base holds, it could mark the foundation for a mid-term reversal. If it fails, however, the broader downtrend is likely to continue.
---
📊 Key Technical Levels
Major Support:
0.1100 → upper bound of accumulation zone
0.0962 → critical low (must hold)
Key Resistances:
R1 = 0.1536 (immediate breakout trigger)
R2 = 0.1894
R3 = 0.2252
R4 = 0.3444 (potential swing target if reversal is confirmed)
---
🟢 Bullish Scenario
1. Breakout of 0.1536:
A strong 2D close above 0.1536, ideally backed by volume, would signal a bullish reversal. First target sits at 0.1894, followed by 0.2252.
2. Accumulation at Support (0.096–0.11):
Gradual accumulation near this zone offers favorable risk/reward for mid-term traders. Stop-loss should be placed just below 0.0962. If successful, upside targets range from +45% to over +150% depending on how far momentum extends.
3. Bullish Confirmation Signals:
RSI/MACD bullish divergence
Rising volume on breakout
Bullish reversal candlestick patterns at support
---
🔴 Bearish Scenario
1. Breakdown Below 0.11:
A decisive close below 0.11 — and especially below 0.0962 — would invalidate the bullish accumulation setup. This would expose STRK to further downside, potentially targeting the 0.076 zone (previous structural low).
2. False Breakout Risk:
Traders should be cautious of bull traps — where price breaks above 0.1536 but quickly falls back into the range. Such moves often occur in weak markets.
---
📐 Pattern & Market Sentiment
Pattern: Rectangle Accumulation at bottom trend
Sentiment: Neutral → turning bullish if breakout above 0.1536 is confirmed
Key Triggers:
Bullish trigger → 0.1536
Bearish trigger → 0.0962
---
⚠️ Notes
Always wait for volume confirmation on breakouts/breakdowns.
Use strict risk management and place stop-losses below/above structural levels.
Watch Bitcoin’s trend as overall market sentiment often drives altcoins.
---
🎯 Conclusion
STRK is currently sitting at a make-or-break zone. This could either be the start of a strong mid-term reversal or just a pause before further decline.
Bullish path: Break & hold above 0.1536 → targets at 0.1894 – 0.2252.
Bearish path: Break below 0.11 → retest of 0.0962 and possibly down to 0.076.
Patience and confirmation will be key.
---
#STRK #STRKUSDT #Starknet #CryptoAnalysis #CryptoTrading #PriceAction #Breakout #Accumulation #SupportResistance
✅ Get Free Signals! Join Our Telegram Channel Here: t.me/TheCryptoNuclear
✅ Twitter: twitter.com/crypto_nuclear
✅ Join Bybit : partner.bybit.com/b/nuclearvip
✅ Benefits : Lifetime Trading Fee Discount -50%
✅ Twitter: twitter.com/crypto_nuclear
✅ Join Bybit : partner.bybit.com/b/nuclearvip
✅ Benefits : Lifetime Trading Fee Discount -50%
Penafian
Maklumat dan penerbitan adalah tidak dimaksudkan untuk menjadi, dan tidak membentuk, nasihat untuk kewangan, pelaburan, perdagangan dan jenis-jenis lain atau cadangan yang dibekalkan atau disahkan oleh TradingView. Baca dengan lebih lanjut di Terma Penggunaan.