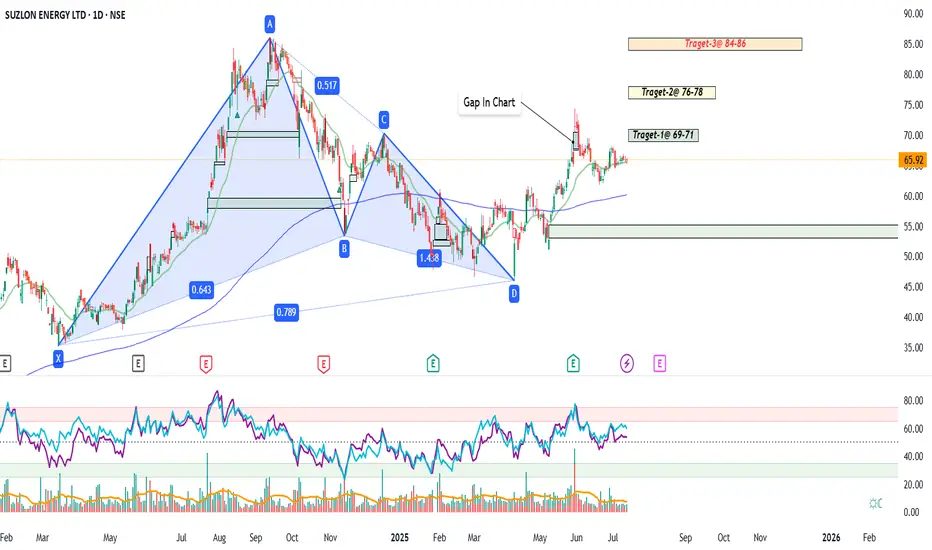
Suzlon Energy – CMP:65.92
•Looking at the chart, Suzlon has just completed a Bullish Harmonic Bat Pattern. After the “D” point was hit, the stock bounced nicely, and it’s now consolidating around ₹66 – which could be the calm before the next move.
•RSI is sitting around 60, which is healthy – not overbought, so room to go higher.
•Volume has picked up recently after the bounce from point D, suggesting buyers are stepping in.
✅ Entry Idea
Right now, Suzlon is trading around ₹66, just above its key EMAs. This is a solid zone to start building a position.
• You can enter around ₹65–67.
• If the stock dips a little more, ₹63–64 is a great place to average or initiate as well (near the 50 EMA).
🔒 Stop Loss
To manage risk:
• Place your stop loss below ₹59.50, just under the 200 EMA and the last structure support.
• If you want a tighter SL, go with ₹61 (that still keeps you safe).
🎯 Target Zones (Think in 3 Stages)
As per the pattern aiming for multiple levels as the pattern unfolds and price fills the upside gaps:
1. Target 1: ₹69-71 – This is a nearby resistance and short-term goal.
2. Target 2: ₹76-78 – There's a visible price gap here + past selling zone.
3. Target 3: ₹84–86 – This is the harmonic target, where the full pattern projects to.
Keep in mind, you don’t have to ride it all the way – partial booking at each target is a smart move.
📌 Thanks a ton for checking out my idea! Hope it sparked some value for you.
🙏 Follow for more insights
👍 Boost if you found it helpful
✍️ Drop a comment with your thoughts below!
Dagangan aktif
Suzlon Energy appears poised for further upside as several bullish technical patterns are visible on the chart. The stock has recently broken out of a falling wedge, and a golden cross is observed, suggesting strengthening bullish momentum. Additionally, a cup and handle pattern is forming, further supporting the potential for upward movement. These signals indicate a favorable setup, and higher targets may be achievable in the near term.
Nota
NoteKeep yourself updated with Idea Worth your time, join my Channel on whatsapp": ""The Crocodile Strategy"
whatsapp.com/channel/0029Vb6zQU1DDmFMeeYP7g0w
Penerbitan berkaitan
Penafian
Maklumat dan penerbitan adalah tidak bertujuan, dan tidak membentuk, nasihat atau cadangan kewangan, pelaburan, dagangan atau jenis lain yang diberikan atau disahkan oleh TradingView. Baca lebih dalam Terma Penggunaan.
Penerbitan berkaitan
Penafian
Maklumat dan penerbitan adalah tidak bertujuan, dan tidak membentuk, nasihat atau cadangan kewangan, pelaburan, dagangan atau jenis lain yang diberikan atau disahkan oleh TradingView. Baca lebih dalam Terma Penggunaan.